
SLIDE 1
Statistical downscaling: Status and open issues
Rob Wilby, Loughborough University, UK
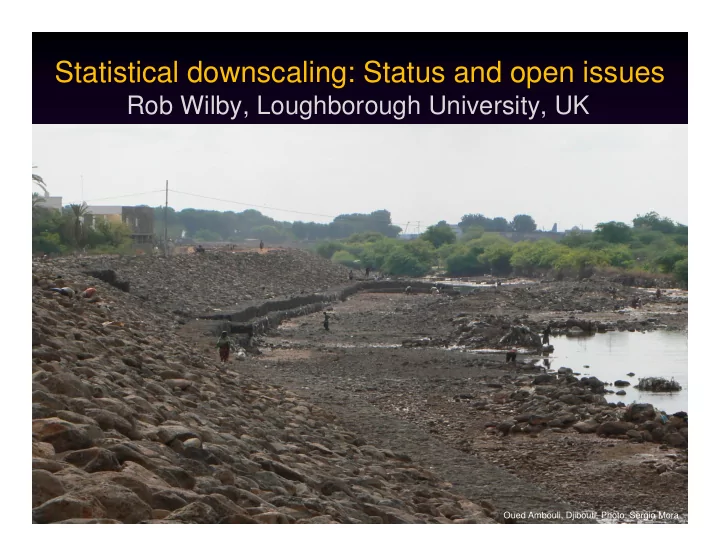
Oued Ambouli, Djibouti. Photo: Sergio Mora
Statistical downscaling: Status and open issues Rob Wilby, - - PowerPoint PPT Presentation
Statistical downscaling: Status and open issues Rob Wilby, Loughborough University, UK Oued Ambouli, Djibouti. Photo: Sergio Mora Raison dtre Flooding of Djibouti by the Oued Ambouli in April 1994 The downscaling mantra What the climate
Oued Ambouli, Djibouti. Photo: Sergio Mora
Flooding of Djibouti by the Oued Ambouli in April 1994
300km km
50km 10km 1m Point
60 80 100 120 ublications
"downscaling and climate" "statistical downscaling" "dynamical downscaling" "downscaling and impact" "downscaling and adapt*"
Number of ISBN research publications listed on the Web of Science. Accessed 10 February 2009
20 40 60
1993 1995 1997 1999 2001 2003 2005 2007
Journal pu Year
Photo: Bull (1930)
The global network of the World Weather Watch (WWW) stations colour coded to indicate silence (red dot) or reporting rates in 2008. Source: WMO (2009)
80 100 120 140 160 180 200 Frequency
20 40 60 10 20 30 40 50 60 70 80 90 100 Fr Daily rainfall total (mm) Distribution of daily precipitation amounts recorded at Ibb (including 14.6 and 15.8 mm on 30 and 31 February 1995!)
10 20 30 40 50 60 ge (%)
Djibouti annual PRCP2050s
2.0 2.5 3.0 3.5 e (degC)
Djibouti annual TMAX 2050s
10 CGCM3 CNRM CSIRO GFDL GISS IPSL MPI Change ( 0.0 0.5 1.0 1.5 2.0 CGCM3 CNRM CSIRO GFDL GISS IPSL MPI Change (d
Data source: Climate Systems Analysis Group, University of Cape Town
Tool/source Description clim.pact R functions for downscaling monthly and daily mean climate scenarios http://cran.r-project.org/src/contrib/Descriptions/clim.pact.html CRiSTAL Community-based Risk Screening – Adaptation and Livelihoods http://www.iisd.org/pdf/2008/cristal_manual.pdf CSAG Data portal for downscaled African precipitation scenarios for the 2080s http://data.csag.uct.ac.za/ ENSEMBLES Experimental portal for downscaling tools applied to Europe http://grupos.unican.es/ai/meteo/ensembles/index.html FINESSI Multi-sector/ multi-variable climate change scenarios for Finland http://www.finessi.info/finessi/?page=explore LARS-WG Tool for producing time series of a suite of climate variables at single sites http://www.rothamsted.bbsrc.ac.uk/mas-models/larswg.php LCA Linking Climate Adaptation – community based adaptation http://www.cba-exchange.org/ MAGICC/ SCENGEN Interactive software for investigations of global/regional climate change http://www.cgd.ucar.edu/cas/wigley/magicc/ PRECIS UK Met Office portable regional climate model http://precis.metoffice.com/
http://precis.metoffice.com/ RClimex Graphical interface to compute 27 core indices of climate extremes http://cccma.seos.uvic.ca/ETCCDMI/software.shtml SDSM Downscaling tool for scenario production at single sites http://www-staff.lboro.ac.uk/~cocwd/SDSM/ SERVIR The Climate Mapper and SERVIR Viz http://www.servir.net/index.php?option=com_content&task=view&id=101&Itemid=57&lang=en Tearfund Mainstreaming disaster risk reduction: a tool for development organisations http://www.tearfund.org/webdocs/Website/Campaigning/Policy%20and%20research/Mainstreaming%20disast er%20risk%20reduction.pdf UKCIP Online adaptation data base (UK) http://www.ukcip.org.uk/resources/tools/database.asp UNFCCC Database on local coping strategies http://maindb.unfccc.int/public/adaptation/ World Bank Indigenous Knowledge Practices Database http://www4.worldbank.org/afr/ikdb/search.cfm WRI Climate Analysis Indicators Tool (CAIT) http://cait.wri.org/ WWF Climate Witness Community Toolkit http://www.wwfpacific.org.fj/publications/climate_change/cw_toolkit.pdf
Source: Wilby & Miller (2008)
UNDP (2006) IPCC (2007)
Djibouti Morocco Yemen Spain Population (1000) 793 31,478 20,975 43,064 Growth rate (%) 2.1 1.5 3.1 1.1 Water per capita (m3/yr) 378 921 195 2578 GDP agriculture (%) 4 16 13 3 Rural water access (%) 59 56 65 100
Source: United Nations Statistics Division (2005)
Source: IPCC AR4 (2007)
Casablanca TAVG 1993 (r=0.88)
5 10 15 20 25 30 35 01/1993 03/1993 05/1993 07/1993 09/1993 11/1993 01/1994 Temperature (degC) Observed SDSM
Casablanca PRCP Dec 1995 to May 1996
10 20 30 40 50 60 01/12/95 01/01/96 01/02/96 01/03/96 01/04/96 01/05/96 01/06/96 Precipitation (mm) Observed SDSM
Casablanca TAVG 1999 (r=0.89)
5 10 15 20 25 30 35 01/1999 03/1999 05/1999 07/1999 09/1999 11/1999 01/2000 Temperature (degC) Observed SDSM
Casablanca PRCP 1991-2000
0.7 0.8 0.9 1.0 10 20 30 40 50 60 70 Precipitation (inches) CDF Observed SDSM
Spring precipitation scenarios
20 40 60 % change UCT-CSIRO UCT-ECHAM4 UCT-HadAM3 SDSM-HadCM3
Projected changes in spring and annual precipitation totals for the 2080s for two downscaling methods (UCT, SDSM) and three climate models (CSIRO, ECHAM4, HadCM3) under A2 emissions
Tanger Mekness Casablanca Beni Mellal Marrakech Oujda Midelt Agadir Ouarzazate
Annual precipitation scenarios
20 40 60
Tanger Mekness Casablanca Beni Mellal Marrakech Oujda Midelt Agadir Ouarzazate
% change UCT-CSIRO UCT-ECHAM4 UCT-HadAM3 SDSM-HadCM3
Source: Wilby & DMN (2007)
Flooding of Djibouti by the Oued Ambouli in April 1994
Improved access and support
Source: IPCC AR4 (2007)
Source: Times Tues 3 February 2009