
SLIDE 1
Economic situation in Finland
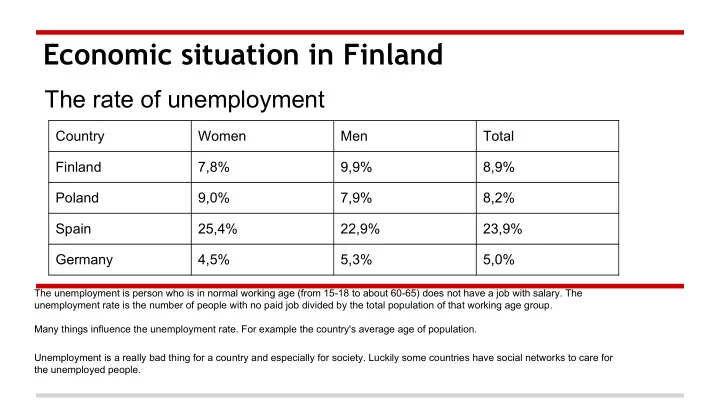
The rate of unemployment
The unemployment is person who is in normal working age (from 15-18 to about 60-65) does not have a job with salary. The unemployment rate is the number of people with no paid job divided by the total population of that working age group. Many things influence the unemployment rate. For example the country's average age of population. Unemployment is a really bad thing for a country and especially for society. Luckily some countries have social networks to care for the unemployed people.
Country Women Men Total Finland 7,8% 9,9% 8,9% Poland 9,0% 7,9% 8,2% Spain 25,4% 22,9% 23,9% Germany 4,5% 5,3% 5,0%