
SLIDE 1
SANITARY SEWER INVESTIGATION RESULTS
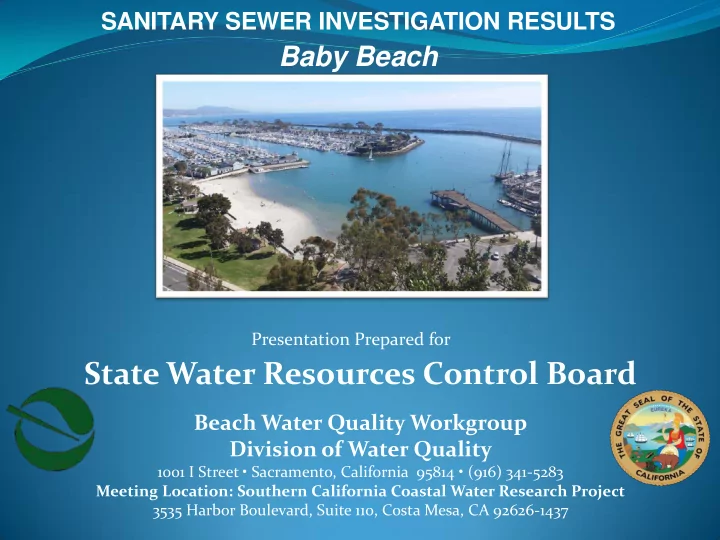
Baby Beach
State Water Resources Control Board
Beach Water Quality Workgroup Division of Water Quality
1001 I Street • Sacramento, California 95814 • (916) 341-5283 Meeting Location: Southern California Coastal Water Research Project 3535 Harbor Boulevard, Suite 110, Costa Mesa, CA 92626-1437
Presentation Prepared for