starting screen
play

Starting screen When you call gretl the following screen would - PowerPoint PPT Presentation

Starting screen When you call gretl the following screen would appear No active part of menu are would appear. No active part of menu are typically in light shadow. Short intro to Gretl software Short intro to Gretl software Free software


  1. Starting screen • When you call gretl the following screen would appear No active part of menu are would appear. No active part of menu are typically in light shadow. Short intro to Gretl software Short intro to Gretl software Free software for econometrics http://gretl.sourceforge.net/
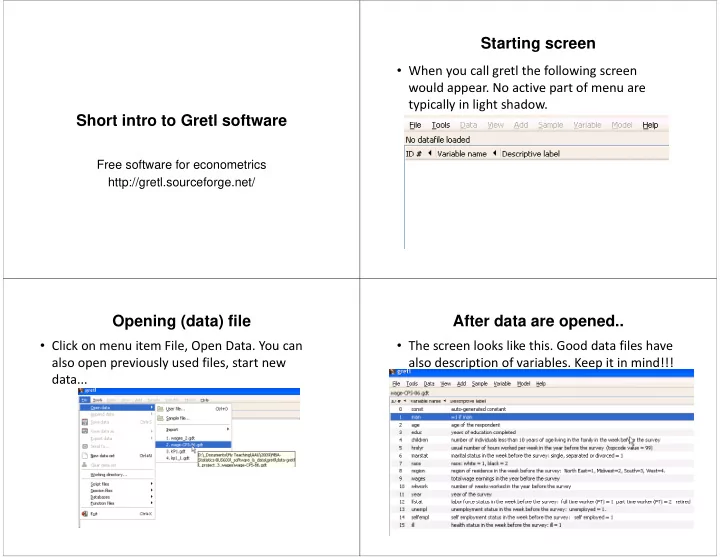
 Opening (data) file After data are opened.. • Click on menu item File, Open Data. You can • The screen looks like this. Good data files have also open previously used files, start new also open previously used files, start new also description of variables. Keep it in mind!!! also description of variables. Keep it in mind!!! data...

  2. We always compute the statistics for You can do any analysis, highlighted variable(s) highlighted variable(s) transformation, descriptive stats transformation descriptive stats • As in your operating system you select • For example we want to see descriptive variables. In Windows, you can use CTRL and i bl I Wi d CTRL d statistics (means, variances, minimum...) i i ( i i i ) Click of the mouse.. On click you get what you marked Defining a new variable • In this case all basic descriptive statistics • In this case menu item Add, define new variable i bl

  3. Defining a new variable Defining a new variable Or menu item • We can write any formula to define new var. Variable Variable, • Here we define wage per week, i.e. Total wage define new divided by total number of week worked. variable variable It is good to add a label (or On a variable, right mouse click description of variable) description of variable) • Once you highlight one variable, left mouse click (windows) can get you into a menu: li k ( i d ) i

  4. Making a useful transformations (squares, logs..) Making a discrete variable… Highlighting more variables … Definitions of new variables • On click of the right mouse offers: Working with restrictions

  5. Highlighting more variables … Test of equality of two means • Select from menu: Tools, • On click of the right mouse offers: Test calculator. • Fill the values for each sub-sample: here is an p example Do not forget to hit g ENTER after you specify each variable Easy control, you have y y different mean & sample 18 Example Example

  6. Reading Regression in gretl • Menu: Model, Ordinary least squares – Dependent variable i is what you model h t d l – Independent variables are variables are factors used in describing (price) describing (price) – After your you make your make your selection, click OK 22 Running a linear regression model

  7. Working with graphs … confidence ellipse Additional analysis … On right mouse click example, confidence intervals We can go back and modify the model

  8. Setting and testing for multiple restrictions Results of the test for linear restrictions

  9. History of all commands – command log What you see in a command log Saving command log and using it as a script Direct command entry – gretl console

  10. Last but not least Command reference – again on a click Icons on the bottom of the page : Icon view: Useful for descriptive statistics Calculator Command reference Script p XY XY Console graphs S Session i OLS Icons Models Functions Open Dataset User’s guide

Download Presentation
Download Policy: The content available on the website is offered to you 'AS IS' for your personal information and use only. It cannot be commercialized, licensed, or distributed on other websites without prior consent from the author. To download a presentation, simply click this link. If you encounter any difficulties during the download process, it's possible that the publisher has removed the file from their server.

Recommend


More recommend