
SLIDE 1
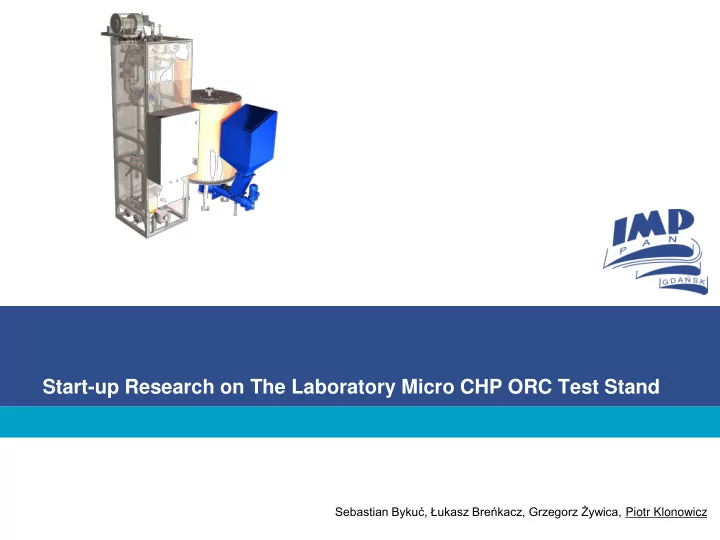
Start-up Research on The Laboratory Micro CHP ORC Test Stand
Sebastian Bykuć, Łukasz Breńkacz, Grzegorz Żywica, Piotr Klonowicz
Start-up Research on The Laboratory Micro CHP ORC Test Stand - - PowerPoint PPT Presentation
Start-up Research on The Laboratory Micro CHP ORC Test Stand Sebastian Byku, ukasz Brekacz, Grzegorz ywica, Piotr Klonowicz System description Features: -Fluid: HFE7100 -Nominal power: 3 kW -Inlet pressure: 12 bar(a) -Inlet temperature:
Sebastian Bykuć, Łukasz Breńkacz, Grzegorz Żywica, Piotr Klonowicz
Features:
Gear pump Gear pump Prototype of peripheral pump
Design paramters: Rotational speed: 35 000 [rpm] Internal power: 3.26 [kW] Working medium: HFE 7100 Design paramters: Rotational speed: 24 000 [rpm] Internal power: 3.00 [kW] Working medium: HFE 7100
Cooperation with Lodz University of Technology (prof. Z. Kozanecki Team)
Model of the ORC power plant test stand Real construction
Flowmeter
Temperature and pressure sensors
100 200 300 400 500 600 700 800 900 1000 100 200 300 400 500 600 700 Q (kg/h) Time (s)
Q1 Q2 Q3
Flow rate I II III
Mass flow rates (Q1- total flow rate, Q2-by-pass flow rate, Q3-turbine flow rate)
100 200 300 400 500 600 700 800 900 1000 1 2 3 4 5 6 7 8 9 10 Pressure of HFE 7100 (bar) Time (s)
P1 after evaporator P2 before turbine P3 after turbine P4 after regenerative heat exchanger P5 after condenser P6 after pump
Pressure I II III
Pressure curves in the time domain obtained during startup
100 200 300 400 500 600 700 800 900 1000 20 40 60 80 100 120 140 160 Temperature (°C) Time (s)
T1 after pump T2 before turbine T3 after turbine T4 after regenerative heat exchanger T5 after condenser T6 after pump
Temperature I II III
Temperature curves in the time domain obtained during startup
100 200 300 400 500 600 700 800 900 1000 2000 4000 6000 8000 10000 12000 14000 16000 18000 20000 22000 24000 26000 Turbine speed (rpm) Time (s) Turbine speed I II III
Rotational speed of turbogenerator in the time domain obtained during startup
100 200 300 400 500 600 700 800 900 1000 200 400 600 800 1000 1200 1400 Electric power (W) Time (s) Electric power I II III
Power generated in the time domain obtained during startup
Electric power plots
The research works presented in this presentation were financed by the project POIG.01.01.02-00-016/08 “Model agroenergy complexes as an example of distributed cogeneration based on local renewable energy sources” Sebastian Bykuć, Łukasz Breńkacz, Grzegorz Żywica, Piotr Klonowicz