
SLIDE 1
Start-Up of a decentralized pilot plant for the anaerobic treatment of domestic wastewater
Laura Fröba, Marisela Vega, Frauke Groß, Antonio Delgado 16.09.16
Start-Up of a decentralized pilot plant for the anaerobic treatment - - PowerPoint PPT Presentation
Start-Up of a decentralized pilot plant for the anaerobic treatment of domestic wastewater Laura Frba , Marisela Vega, Frauke Gro, Antonio Delgado 16.09.16 Objective of the study - autarc wastewater treatment of small settlements and
Start-Up of a decentralized pilot plant for the anaerobic treatment of domestic wastewater
Laura Fröba, Marisela Vega, Frauke Groß, Antonio Delgado 16.09.16
Objective of the study
industrial scale 200 m³/ d 2000 PE pilot scale 2 m³/ d 20 PE lab scale 0,014 m³/ d
2
megacities
(saving potential about 60%) service water domestic wastewater decentral easy to use
self-defined limit values (AbwV 2016, BayBadeGewV 2008) COD: 75 mg/l NH4-N: 10 mg/l TN: 13 mg/l TP: 1 mg/l E.coli 900 cfu/ 100 ml
anaerobic
domestic wastewater COD: 200 mg/l NH4-N: 40 mg/l TN: 50 mg/l TP: 5 mg/l E.coli: 10^6 cfu/100ml
service water R1 R3 Buffer tank anaerobic digestion Anammox post-treatment pre-heating domestic wastewater R2
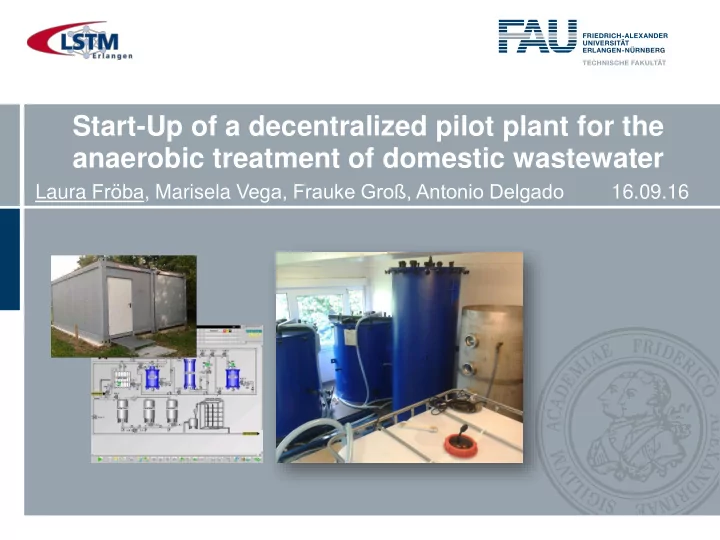
Pilot plant for treating domestic wastewater
reactor 1 (R1) and 2 (R2)
reactor 3 (R3)
R1 + R3: anaerobic sequencing batch reactor (1300 liters each) R2: fixed bed reactor
buffer tank reactor 1 reactor 2 reactor 3 sand filter activated carbon
5
Pilot plant for treating domestic wastewater
flexible, modular and space efficient (decentral) caustic reactor 1 reactor 2 reactor 3 post treatment buffer electrical cabinet
5
sludge
digestion plant (Obermichelsbach, GE)
sludge coming from a Deammonification (DEMON)-System (Fulda, Gläserzell, GE)
Start-Up of the pilot plant
5
reactor 1 reactor 2 reactor 3 adaptation phase 100% MWW adaptation phase 100% MWW + organic acids (acetic acid: propionic acid: butyric acid in 2:1:1) adaptation phase 100% SWW (1000 liters of tab water added with ammonia sulfate (40mg/l) and sodium nitrite (50mg/l)) stepwise interconnection of R1 and R2 to 33%, 50%, 75% and 100% 100%: no addition of organic acids to R2 stepwise interconnection of anaerobic digestion (outlet of R2) and R3 to 20%, 50%, 80% and 100% 100%: - no addition of ammonia sulfate to R3
(MWW: municipal wastewater, SWW: synthetic wastewater)
200 days of operation after start-up feeding of 100% MWW additive: sodium nitrite (R3)
Start-Up of the two-stage anaerobic digestion (R1 + R2)
6
(I) adaptation phase (R2) COD removal efficiency increased from 31% to 53% 10 20 30 40 50 60 70 80 90 100
75 150 225 300 375 450 525 600 675 750 825 900 975 1050
1 2 3 4 5 6 7 8 9 10 11 12 13 14 15 16 17 18 19 COD removal efficiency [%] chemical oxygen demand (COD) [mg/l] batch-no.
inlet COD [mg/l] COD [mg/l]
COD removal efficiency [%] (II) (III) (I)
(II) Interconnection of R1 to R2 (33%, 50%, 75%,100%) COD removal efficiency increased to 71% (III) Testing of the two-stage anaerobic digestion average COD removal efficiency 62%
Start-up of two-stage anaerobic digestion was successful Self-defined service water limit value of 75 mg/ l could almost be reached
Start-Up of the Anammox-stage (R3)
7
20 40 60 80 100 120 10 20 30 40 50 60 70 80 90 100 110 120 1 2 3 4 5 6 7 8 9 10 11 12 13 14 15 16 17 18 19
NH4-N removal efficiency [%] nitrogen concentration [mg/L] batch-No.
NH4-N [mg/L] start NO2-N [mg/l] NH4-N Removal efficiency [%]
(I) (II) (III)
(IV) (V)
(VI)
(I): 100% SWW, (II): 20% MWW (III): 50% MWW, (IV): 80% MWW, (Ⅴ): 100% MWW
(I) adaptation phase (R3) NH4-N removal efficiency inbetween 80% to 90% (I)-(V) interconnection of anaerobic digestion to R3 (20%, 50%, 80%, 100%) NH4-N removal efficiency decreased from 72% to 48% (VI) adjustment of substrate to feed ratio (NO2-N/ NH4-N) NH4-N removal efficiency rised to 92%
start-up of the Anammox-stage was successful self-defined service water limit value of 10 mg/ l could be reached
Optimum substrate to feed ratio of the Anammox-stage in pilot scale: 1.14 mg/ l
Degradation performance after 200 days of operation
8
212 85 39 60% 21% 0% 20% 40% 60% 80% 100% 50 100 150 200 250 300 removal efficiency [%] COD-concentration [mg/ l]
46 50 1 96% 0% 20% 40% 60% 80% 100% 10 20 30 40 50 60 70 80 removal efficiency [%] NH4-N concentration [mg/ l]
Self-defined service water limit values:
COD: 75 mg/ l NH4-N: 10 mg/ l
further optimization of 2-stage anaerobic digestion needed with Anammox-stage limit value is guaranteed
Conclusion
9
self-defined service water limit value of 75 mg/l could always be reached with R3 connected in downstream
self-defined service water limit value of 10 mg/l could always reached only by R3 two-stage anaerobic digestion is limiting process-step, thus further
Thank you for your attention!
10
buffer tank reactor 1 reactor 2 reactor 3 sand filter activated carbon
anaerobic digestion Anammox post-treatment pre-heating
Acknowledgements:
11
Challenges of the project guarantee Process stability Challenges of decentral installation easy to use energy- and cost efficency domestic purpose different wastewater composition (place of installation) Varying concetrations (seasonal)
(pH, T)
noise emission < 35 dB space saving low investment costs low operation costs automated low maintenace robust
Concept of the pilot plant
R3 R2
VB_1 BV_R3LSH
312
LSL
311
LSH
212
LSL
211
LSH
112
LSL
111
QIRC
230
pHQIRC
340
conductivityQIRC
130
pHQIRC
140
NH4TRC
120
TR
220
QIRC
330
pHTRC
320
VB_2influent
Organikabbau (2. Stufe)
base R1
LSH
001
V_R1_1 V_P_ 1 V_N_2LSL
002
Effluent
V_N_5 V_N_6 V_N_7 V_R1_ 2 V_R1_5 V_R2_ 3 V_R2_2 V_R2_1 V_R3_1 V_R3_2 V_R3_3 V_R3_4 V_R3_5Biogas
1“ PVC Φ 1“ PVC Φ 1“ PVC Φ 1“ PVCPuffer- tank
Φ 1“ PVCM 10 M 4 M 1 M 5 M 7 M 2 M 6
V_A_1buffer- tank
Organic digestion (1. step) Organic digestion (2. step) Nitrogen removal (3. step)
Sandfilte r 3 Sandfilte r 2 Sandfilte r 1 buffer- tank Activated carbon
Conecpt of process control Basic automation and process monitoring State detection Fuzzy-Neuro experts ystem Ablaufplan basic automation (PCS7) analytics R 1 R 2 R 3
Online: Temperature X X X pH X X X conductivity X Offline: COD X X X NH4-N X X TN X I/O-cuppler
[ET 200 M] [IM 153 -2]
analytic sensors (Hach-Lange) FU
Profibus DP DC-USV DP/ PA - Link Profibus PA R 1 R 2 R 3 plant bus ES/OS-Single Station (Web-Anbindung) PG-Gerät
temperature sensors
CPU 417-4H
[SIMATIC PCS7]
FU
Methods for guaranteeing process stability Fuzzy Logic (FL) (expert knowledge) Proportional Integral Differential (PID) controller Mathematic models (differential equations) Artificial Neuronal Nets (ANN) For pH-control
50 70 90 110 30 10 for state detection Protection against overload in anaerobic digestion (Anaerobic Digestion Model
Process stability
Estimation of NH4 degradation
50 100 150 200 250 300 350 400 450 500 1000 1500 2000 2500 3000 3500 4000 Time [h] Concentration [mg/l] Input Net: pH, HRT / Otuput Net: Acetic, Butyric & Propionic Acid pH = 8 pH = 6 AceticNet ButyricNet PropionicNet AceticExp ButyricExp PropionicExpbased on ΔpH/ Δt
Ordinary differential equations (ODE) model: Anaerobic Digestion Model No. 1 (ADM1)*
12 soluble components (𝑇𝑗|𝑗=1 −12) 12 particulate components (𝑌𝑗|𝑗=13 −24) (7 groups of microorganisms) 19 biochemical processes 5 physico-chemical processes 4 inhibition functions
Modeling Two-stage Anaerobic Digestion
Plant specific Modifications:
(hydrolysis + acidogenesis → R1
acetogenesis + methanogenesis → R2)
R 2
Hydrolysis Acidogenesis Acetogenesis Methanogenesis
Xsu, Xaa, Xfa
⃰ Batstone, D.J., Keller, J., Angelidaki, I., Kalyuzhnyi, S.V., Pavlostathis, S.G., Rozzi, A., Sanders, W.T.M., Siegrist, H. and Vavilin, V.A. (2002). Anaerobic digestion model no. 1. Scientific and Technical Report No. 13, IWA Publishing, London.
Xc4, Xpro Xac, Xh2 Sch4, Sco2 Sbu, Sva, Spro Sac Sh2,Sco2 Xch, Xpr, Xli Ssu, Saa, Sfa
R 1
Total inorganic carbon Total ammonia-nitrogen
† ‡
COD → *0.5𝑌𝑑ℎ + 0.4𝑌𝑞𝑠 + 0.1𝑌𝑚𝑗 TIC → 𝑇𝐼𝐷𝑃3 TAN → 𝑇𝑂𝐼4 1) 2) 3)
* Schlegel, H.G. and Fuchs, G. (2007). General Microbiology (Allgemeine Mikrobiologie), Eigth Edition. Georg Thieme Verlag, Stuttgart. P. 625.
Transformation method for domestic wastewater
Chemical measurements:
Model input
Modeling Two-stage Anaerobic Digestion
† ‡
Model calibration/validation: Total COD
Model R2 Model R1
Easy to use
18
Economic feasability study
Wastewater costs of central wastewater treatment in Germany Middle Franconia: 2,25 €/ m³ Brandenburg: 3,35 € /m³ 20 PE plant 200 PE plant capacity 730 m³/ a 7.300 m³/ a useful life 30 Jahre 30 Jahre required rate of return 7 % 7 % fixed costs 7.251 €/ a 8.967 €/ a investment costs 103.185 € 128.300 € amortisation costs 3.439 €/ a 4.277 €/ a
200 €/ a 200 €/ a average interest 3.611 €/ a 4.491 €/ a variable costs 6.733 €/ a 24.511 €/ a total average costs 13.983 €/ a 33.478 €/ a wastewater costs 19,16 €/ m³ 4,59 €/ m³
19