
SLIDE 1
- U. S . A . G er m any F r anc e S we de n Uni t ed K i ngd om J ap a n K o r e a Chi n a
Standardized Work Workshop (SWW)
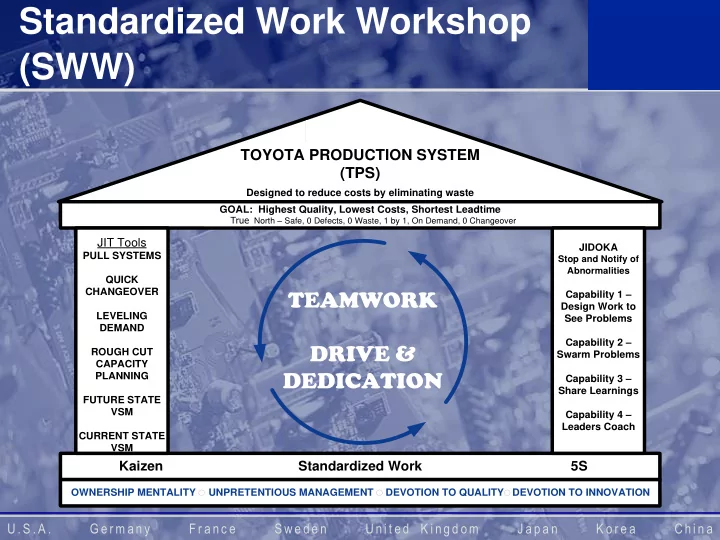
TOYOTA PRODUCTION SYSTEM (TPS)
Designed to reduce costs by eliminating waste GOAL: Highest Quality, Lowest Costs, Shortest Leadtime
Gentex True North – Safe, 0 Defects, 0 Waste, 1 by 1, On Demand, 0 Changeover
Standardized Work 5S Kaizen
JIT Tools
PULL SYSTEMS QUICK CHANGEOVER LEVELING DEMAND ROUGH CUT CAPACITY PLANNING FUTURE STATE VSM CURRENT STATE VSM JIDOKA
Stop and Notify of Abnormalities
Capability 1 – Design Work to See Problems Capability 2 – Swarm Problems Capability 3 – Share Learnings Capability 4 – Leaders Coach OWNERSHIP MENTALITY UNPRETENTIOUS MANAGEMENT DEVOTION TO QUALITY DEVOTION TO INNOVATION
TEAMWORK DRIVE & DEDICATION
True