SLIDE 1 STA 326 2.0 Programming and Data Analysis with R Generating Random Numbers Using the Inverse Transform Method
Prepared by Dr Thiyanga Talagala
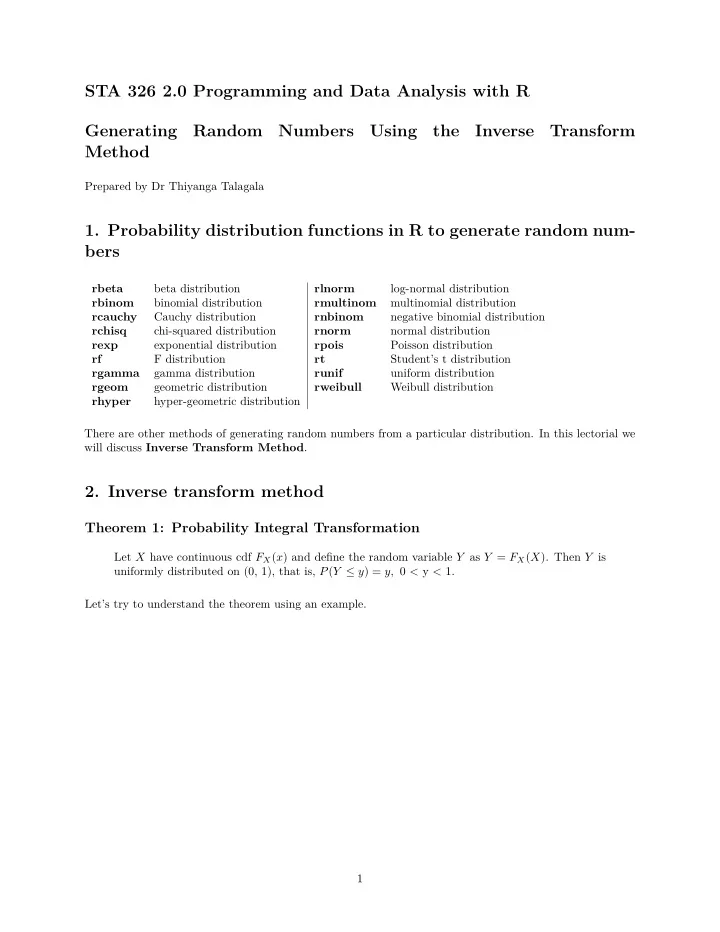
- 1. Probability distribution functions in R to generate random num-
bers
rbeta beta distribution rlnorm log-normal distribution rbinom binomial distribution rmultinom multinomial distribution rcauchy Cauchy distribution rnbinom negative binomial distribution rchisq chi-squared distribution rnorm normal distribution rexp exponential distribution rpois Poisson distribution rf F distribution rt Student’s t distribution rgamma gamma distribution runif uniform distribution rgeom geometric distribution rweibull Weibull distribution rhyper hyper-geometric distribution There are other methods of generating random numbers from a particular distribution. In this lectorial we will discuss Inverse Transform Method.
- 2. Inverse transform method
Theorem 1: Probability Integral Transformation
Let X have continuous cdf FX(x) and define the random variable Y as Y = FX(X). Then Y is uniformly distributed on (0, 1), that is, P(Y ≤ y) = y, 0 < y < 1. Let’s try to understand the theorem using an example. 1
SLIDE 2
2
SLIDE 3 Useful results to prove the theorem. Result 1: If FX is strictly increasing, then F −1
X
is well defined by F −1
X (y) = x ⇔ FX(x) = y.
If FX is constant on some interval, then F −1
X
is not well defined by the above equation. To avoid this problem we define F −1
X (y) for 0 < y < 1 by
F −1
X (y) = inf{x : FX(x) ≥ y}.
3
SLIDE 4 Result 2: If FX is strictly increasing, then it is true that F −1
X (FX(x)) = x.
Proof of Theorem 1: For Y = FX(X) we have, for 0 < y < 1, 4
SLIDE 5
We can use Theorem 1 to generate random numbers from a particular distribution. 5
SLIDE 6
- 3. Steps in deriving random numbers using integral transformation
method
- 1. Derive the cumulative distribution function of fX(x)
- 2. Derive the inverse function F −1
X (u).
- 3. Write a function to generate random numbers.
- Generate u from Uniform(0, 1).
- compute x = F −1
X (u).
Example 1
Write a function to generate n random numbers from the distribution with density fX(x) = 3x2, 0 < x < 1. Step 1: Find the cumulative distribution function of fX(x), FX(x) = x3 for 0 < x < 1 6
SLIDE 7 Step 2: Next we need to compute F −1
X (u),
F −1
X (u) = u
1 3 .
Step 3: R function generate_it <- function(n){ # Generate random numbers u <- runif(n) xgen <- u^(1/3) xgen } set.seed(2020) generate_it(10) 7
SLIDE 8
[1] 0.8648611 0.7332437 0.8520145 0.7812795 0.5143788 0.4069300 0.5054766 [8] 0.7325562 0.1372012 0.8527963 Visualisation of theoretical distribution library(tidyverse) # Theoretical distribution values theoretical.df <- tibble(x = seq(0, 1, 0.01), fx = 3*x^2) ggplot(theoretical.df, aes(x = x, y = fx)) + geom_line(col = "red")
1 2 3 0.00 0.25 0.50 0.75 1.00
x fx
Visualize empirical distribution - counts empirical.df <- data.frame(data.emp = generate_it(1000)) # Plot empirical distribution - counts ggplot(empirical.df, aes(x = data.emp))+ geom_histogram(col = "white", binwidth = 0.05)
50 100 0.25 0.50 0.75 1.00
data.emp count
8
SLIDE 9
Visualize empirical distribution - density ggplot(empirical.df, aes(x = data.emp, y=..density..)) + geom_histogram(col = "white", binwidth = 0.05)
1 2 0.25 0.50 0.75 1.00
data.emp density
Visualize theoretical distribution and empirical distribution together ggplot(empirical.df, aes(x = data.emp, y=..density..)) + geom_histogram(col = "white", binwidth = 0.05) + geom_line(data = theoretical.df, aes(x = x, y = fx), color = 'red')
1 2 3 0.00 0.25 0.50 0.75 1.00
data.emp density
9
SLIDE 10
Function to generate random numbers and visualize theoretical and empirical distributions generate_it_dist <- function(n){ # Generate random numbers u <- runif(n) xgen <- u^(1/3) xgen # values for empirical distribution empirical.df <- data.frame(xgen=xgen) # values for the theoretical distribution theoretical.df <- tibble(x = seq(0, 1, 0.01), fx = 3*x^2) # arrange values and plot into a list list( xgen, ggplot2::ggplot(empirical.df, aes(x=xgen, y=..density..)) + geom_histogram(col="white", binwidth = 0.01) + geom_line(data = theoretical.df, aes(x = x, y = fx), color = 'red') ) } Run the following codes and check the outputs. # Sample size 10 generate_it_dist(10) # Sample size 100 n100 <- generate_it_dist(100) n100 n100[[1]] n100[[2]] # Sample size 10000 n10000 <- generate_it_dist(10000) n10000[[2]] 10
SLIDE 11
Example 2 i) Write a function to generate random numbers from the Exponential(λ) distribution using the inverse transformation method. ii) Generate 1000 random numbers from the Exponential(2) distribution. 11
SLIDE 12
iii) Graph the density histogram of the sample with the Exponential(2) density superimposed for compari- son. 12