
SLIDE 1
9/23/2016 1
SRI LANK SRI LANKA
Trade and Investment Trade and Investment Opportunities Opportunities
SRI LANKA
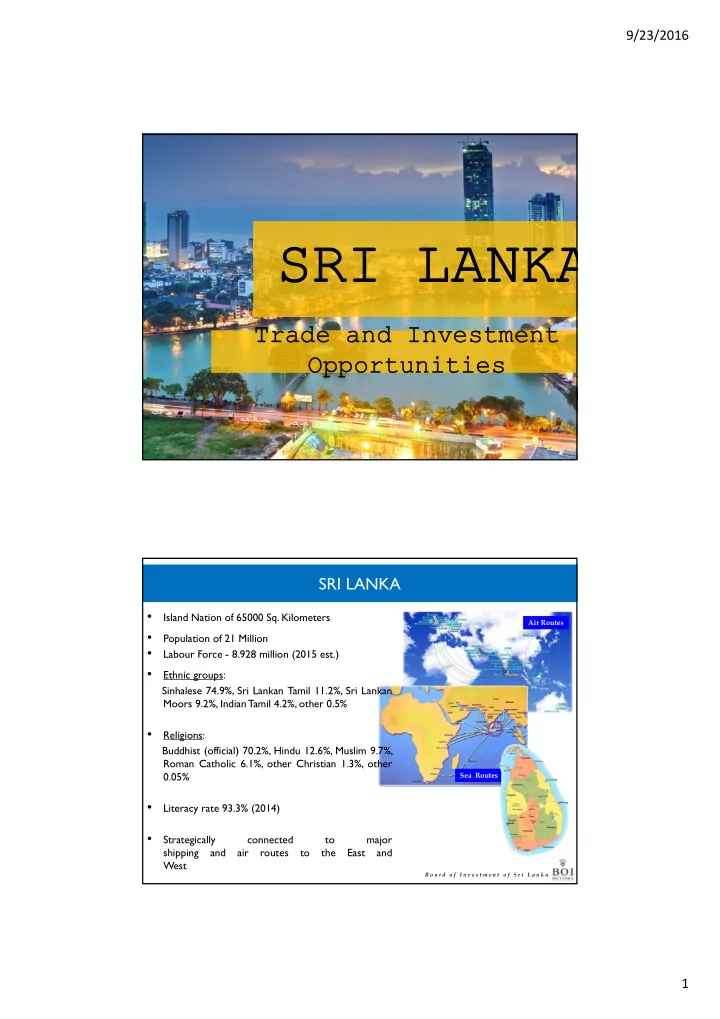
Air Routes Sea Routes
- Island Nation of 65000 Sq. Kilometers
- Population of 21 Million
- Labour Force - 8.928 million (2015 est.)
- Ethnic groups:
Sinhalese 74.9%, Sri Lankan Tamil 11.2%, Sri Lankan Moors 9.2%, IndianTamil 4.2%, other 0.5%
- Religions:
Buddhist (official) 70.2%, Hindu 12.6%, Muslim 9.7%, Roman Catholic 6.1%, other Christian 1.3%, other 0.05%
- Literacy rate 93.3% (2014)
- Strategically
connected to major shipping and air routes to the East and West
B o a r d o f I n v e s t m e n t o f S r i L a n k a