South Pole Ozonesonde and Dobson Spectrophotometer Measurements: - - PowerPoint PPT Presentation

south pole ozonesonde and dobson spectrophotometer
SMART_READER_LITE
LIVE PREVIEW

South Pole Ozonesonde and Dobson Spectrophotometer Measurements: - - PowerPoint PPT Presentation

South Pole Ozonesonde and Dobson Spectrophotometer Measurements: 2012 Ozone Hole Bryan J. Johnson 1 , R. Evans 1 ,P. Cullis 2 , C. Sterling 2 , G. McConville 2 D. Quincy 2 , I Petropavlovskikh 2 , S. Oltmans 2 . 1 NOAA Earth System Research


slide-1
SLIDE 1

South Pole Ozonesonde and Dobson Spectrophotometer Measurements: 2012 Ozone Hole

1

Bryan J. Johnson1, R. Evans1,P. Cullis2, C. Sterling2, G. McConville2 D. Quincy2, I Petropavlovskikh2,

  • S. Oltmans2.

1NOAA Earth System Research Laboratory, 325 Broadway, Boulder, CO 80305

(303) 497-6842 , email: bryan.johnson@noaa.gov

2CIRES, University of Colorado and NOAA/ESRL Global Monitoring Division, Boulder, Colorado, USA

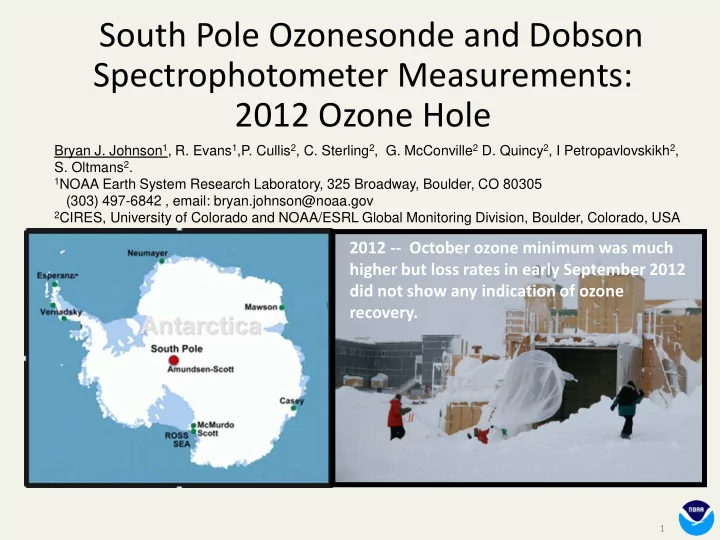
2012 -- October ozone minimum was much higher but loss rates in early September 2012 did not show any indication of ozone recovery.

slide-2
SLIDE 2

UV

NOAA GMD measures stratospheric ozone at South Pole from:

  • 1. Ground-based Dobson spectrophotometer: 51 years 1962-2012
  • 2. Balloon-borne ozonesondes:

27 years 1986-2012 Total Column ozone

2

Balloon-Borne Ozonesonde

slide-3
SLIDE 3
  • The Ground-based Dobson spectrophotometer and balloon-borne
  • zonesondes - a good combination for tracking stratospheric ozone.
  • Dobson measures total column ozone as the view of the sun passes by

the ARO Dobson room windows.

3

Ozonesonde launch at Balloon Inflation Facility (BIF) Dobson Spectrophotometer at Atmospheric Research Observatory (ARO)

slide-4
SLIDE 4

Summary of South Pole Sun Elevation Angle and Corresponding Ozone Measurements.

Increased frequency of

  • zonesonde launches during
  • zone hole period.

4

slide-5
SLIDE 5

NOAA/ESRL Global Monitoring Division Laboratory Review, April 3-5, 2013 5

slide-6
SLIDE 6

NOAA/ESRL Global Monitoring Division Laboratory Review, April 3-5, 2013

The maximum and min range show large variability of total column

  • zone beginning after Sept 25.

6

slide-7
SLIDE 7

NOAA/ESRL Global Monitoring Division Laboratory Review, April 3-5, 2013 7

136 DU ranks as 23rd lowest minimum

  • zone total in 27

year record

slide-8
SLIDE 8

8

2006 Ozonesonde Profiles 2012

slide-9
SLIDE 9

9

2006 Ozonesonde Profiles 2012

2 4 6 8 2 4 6 8 2 4 6 8 2 4

High ozone from outside the vortex

slide-10
SLIDE 10

10

Jan Feb Mar Apr May Jun Jul Aug Sep Oct Nov Dec

COLUMN OZONE (Dobson Units)

SOUTH POLE OZONE 12-20 KM COLUMN 20 40 60 80 100 120 140 160 180 200 20 40 60 80 100 120 140 160 180 200

Average Range 1986-2010 Max & Min ↓

1967-1971 1986-1990

Sondes flown at South Pole from 1967-1971 provide a good representation of full ozone hole recovery (>50 yrs: Newman) The slower rate of ozone depletion in the 12-20 km layer during 1986-1990 is a good representation for first signs of

  • recovery. (~4-9 yrs: Hassler)

Linear Dobson Units/Day

slide-11
SLIDE 11

11

Jan Feb Mar Apr May Jun Jul Aug Sep Oct Nov Dec

COLUMN OZONE (Dobson Units)

SOUTH POLE OZONE 12-20 KM COLUMN 20 40 60 80 100 120 140 160 180 200 20 40 60 80 100 120 140 160 180 200

Average Range 1986-2010 Max & Min ↓

1967-1971 1986-1990 1991-1995

5 Year Averages

slide-12
SLIDE 12

12

Jan Feb Mar Apr May Jun Jul Aug Sep Oct Nov Dec

COLUMN OZONE (Dobson Units)

SOUTH POLE OZONE 12-20 KM COLUMN 20 40 60 80 100 120 140 160 180 200 20 40 60 80 100 120 140 160 180 200

Average Range 1986-2010 Max & Min ↓

1967-1971 1986-1990 1991-1995 1996-2000

slide-13
SLIDE 13

13

Jan Feb Mar Apr May Jun Jul Aug Sep Oct Nov Dec

COLUMN OZONE (Dobson Units)

SOUTH POLE OZONE 12-20 KM COLUMN 20 40 60 80 100 120 140 160 180 200 20 40 60 80 100 120 140 160 180 200

Average Range 1986-2010 Max & Min ↓

1967-1971 1986-1990 1991-1995 1996-2000 2001-2005

slide-14
SLIDE 14

14

Jan Feb Mar Apr May Jun Jul Aug Sep Oct Nov Dec

COLUMN OZONE (Dobson Units)

SOUTH POLE OZONE 12-20 KM COLUMN 20 40 60 80 100 120 140 160 180 200 20 40 60 80 100 120 140 160 180 200

Average Range 1986-2010 Max & Min ↓

1967-1971 1986-1990 1991-1995 1996-2000 2001-2005 2006-2010

slide-15
SLIDE 15

15

Jan Feb Mar Apr May Jun Jul Aug Sep Oct Nov Dec

COLUMN OZONE (Dobson Units)

SOUTH POLE OZONE 12-20 KM COLUMN 20 40 60 80 100 120 140 160 180 200 20 40 60 80 100 120 140 160 180 200

Average Range 1986-2010 Max & Min ↓

1967-1971 1986-1990 1991-1995 1996-2000 2001-2005 2006-2010 2011

slide-16
SLIDE 16

16

Jan Feb Mar Apr May Jun Jul Aug Sep Oct Nov Dec

COLUMN OZONE (Dobson Units)

SOUTH POLE OZONE 12-20 KM COLUMN 20 40 60 80 100 120 140 160 180 200 20 40 60 80 100 120 140 160 180 200

Average Range 1986-2010 Max & Min ↓

1967-1971 1986-1990 1991-1995 1996-2000 2001-2005 2006-2010 2011 2012

slide-17
SLIDE 17

“September loss rate dropping below about 3 DU/day at 12-20km can be used as another ozone recovery indicator”. David Hofmann et al. 1997 JGR

17

slide-18
SLIDE 18

Summary

GMD monitors stratospheric ozone at South Pole Station:

  • - Ground based Dobson Spectrophotometer observations

(51 year record).

  • - Balloon-borne ozonesonde profiles (27 year record).
  • Total column minimum ranked at #23 in 27 year record for
  • zonesondes.
  • 12-20 km layer reduces influence of dynamics and shows the

depletion rate remains in typical 3.2 to 3.8 DU per day range.

  • When do we expect first signs of recovery at South Pole?

“Assuming a lineal relationship between ozone loss rate and Equivalent Effective Stratospheric Chlorine - a reduction of the ozone loss rate at South Pole station will be detectable in 2017-2021 period “ Hassler et al., (2011).

18