
SLIDE 1
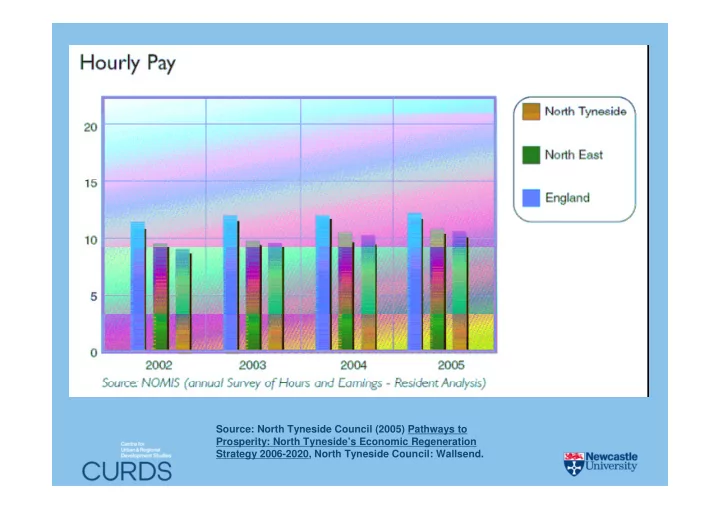
Source: North Tyneside Council (2005) Pathways to Prosperity: North Tyneside’s Economic Regeneration Strategy 2006-2020, North Tyneside Council: Wallsend.
Source: North Tyneside Council (2005) Pathways to Prosperity: North - - PowerPoint PPT Presentation
Source: North Tyneside Council (2005) Pathways to Prosperity: North Tynesides Economic Regeneration Strategy 2006-2020, North Tyneside Council: Wallsend. Data, information and knowledge Source: Burton-Jones, T. (1999) Knowledge Capitalism:
Source: North Tyneside Council (2005) Pathways to Prosperity: North Tyneside’s Economic Regeneration Strategy 2006-2020, North Tyneside Council: Wallsend.
Source: Burton-Jones, T. (1999) Knowledge Capitalism: Business, Work and Learning in the New Economy, Oxford University Press: Oxford.
Source: Local Futures (2003: 13) Regional Employment and Skils in the Knowledge Economy, Local Futures: London.
Source: Hepworth, M. and Spencer, G. (2003) A Regional Perspective
Department of Trade and Industry, Local Futures Group: London.
Tot al R&D per capit a by Region in 2002 100 200 300 400 500 600 700 East ern S out h East Sout h West East Midlands Nort h West and Merseyside London S cot land West Midlands Y
and t he Humber Nort hern Ireland Wales Nort h East
Source: DTI (2005) Regional Innovation Patterns: Summary Note, DTI: London.
Source: Pike, A., Rodríguez-Pose, A. and Tomaney, J. (2006) Local and Regional Development, Routledge: London.
Source: Census (2001) from ONS Neighbourhood Statistics.
Source: North Tyneside Council (2005) Pathways to Prosperity: North Tyneside’s Economic Regeneration Strategy 2006-2020, North Tyneside Council: Wallsend.
Source: Census (2001) from ONS Neighbourhood Statistics.
Source: ONE North East (2006) Leading the Way: Regional Economic Strategy 2006-2016, ONE North East: Newcastle Upon Tyne.