sosc performance indicators
play

SOSC Performance Indicators Quarter 2 2018-19 Paul Underwood Head - PDF document

07/11/18 SOSC Performance Indicators Quarter 2 2018-19 Paul Underwood Head of Policy & Culture 01707 357220 / p.underwood@welhat.gov.uk Performance Indicator 11 Visits to and use of local museums and galleries, in person (per 1,000


  1. 07/11/18 SOSC Performance Indicators Quarter 2 2018-19 Paul Underwood Head of Policy & Culture 01707 357220 / p.underwood@welhat.gov.uk 
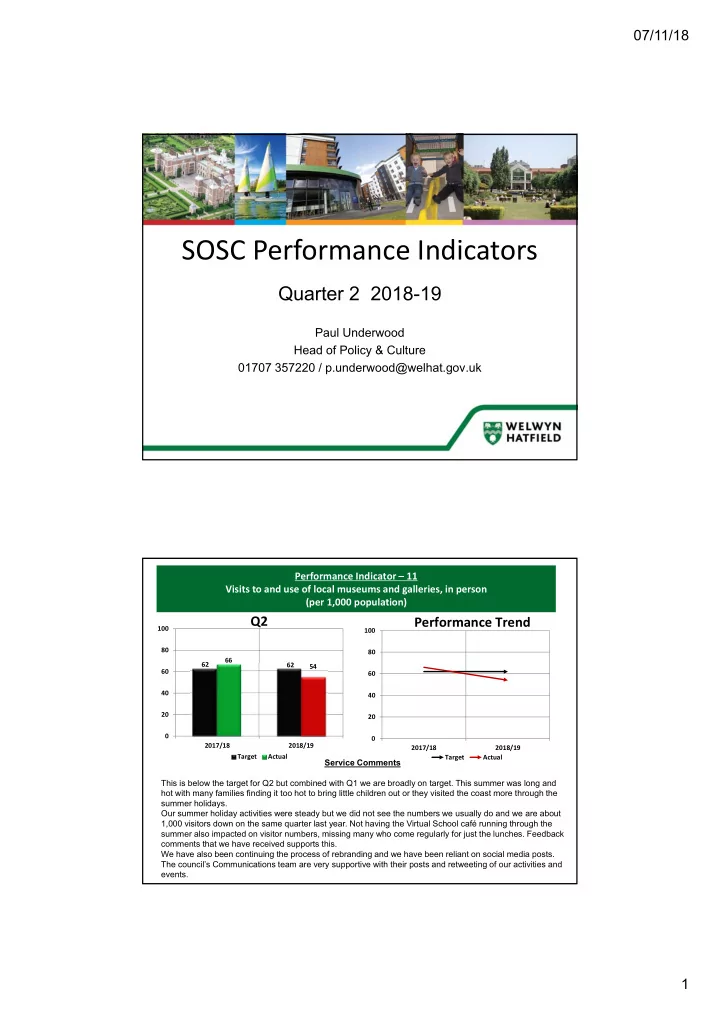
Performance Indicator – 11 Visits to and use of local museums and galleries, in person (per 1,000 population) Q2 Performance Trend 100 100 80 80 66 62 62 54 60 60 40 40 20 20 0 0 2017/18 2018/19 2017/18 2018/19 Target Actual Target Actual Service Comments This is below the target for Q2 but combined with Q1 we are broadly on target. This summer was long and hot with many families finding it too hot to bring little children out or they visited the coast more through the summer holidays. Our summer holiday activities were steady but we did not see the numbers we usually do and we are about 1,000 visitors down on the same quarter last year. Not having the Virtual School café running through the summer also impacted on visitor numbers, missing many who come regularly for just the lunches. Feedback comments that we have received supports this. We have also been continuing the process of rebranding and we have been reliant on social media posts. The council’s Communications team are very supportive with their posts and retweeting of our activities and events. 1

  2. 07/11/18 Performance Indicator – 12 School group visits and use of museums and galleries Q2 Performance Trend 800 800 567 600 600 400 400 411 400 400 200 200 0 0 2017/18 2018/19 2017/18 2018/19 Target Actual Target Actual Service Comments This target has been exceeded for the second quarter, the result of increased marketing to schools as well as teacher’s recommendations to each other. We have been developing the whole learning support team from casual staff to volunteers and we are now working more cohesively. We have learnt that museum gallery interpretation delivered by a member of our team rather than by teachers makes for a much better visit for schools but that has an impact on the salary budget. The Education Officer is contracted to work 22.5 hours a week so there is a limit to how many schools we can welcome over the year, but bookings for October and November are at capacity. Performance Indicator – 13 The total number of tickets sold across all businesses at CW Entertainment, (excluding private party bookings) Q2 Performance Trend 80,000 100,000 59,666 60,000 60,000 58,123 80,000 60,000 60,000 40,000 40,000 20,000 20,000 0 0 2017/18 2018/19 2017/18 2018/19 Target Actual Target Actual Service Comments The very hot July weather was a determining factor in poor sales for this quarter, being 34% less than the same month last year. However with the strong film product (Mamma Mia 2 and Incredibles 2) and the school summer holidays, August was 13% up on 2017. Sales for the overall quarter ended up just under 1% less than they were in 2017, and just over 3% short of their quarterly target, due to the weather which meant people spent more time outside over this period. 2

  3. 07/11/18 Performance Indicator – 14 The percentage of customers satisfied with value for money across all services offered by CW Entertainment Q2 Performance Trend 98.18% 100.00% 100.00% 91.03% 90.00% 90.00% 80.00% 80.00% 60.00% 60.00% 40.00% 40.00% 20.00% 20.00% 0.00% 0.00% 2017/18 2018/19 2017/18 2018/19 Target Actual Target Actual Service Comments The outturn is above target for this quarter. This suggests we are on track to achieve out target for the year. It is worth noting that out of the 1,616 overall responses in this quarter to our rolling Net Promoter Score survey, only 17 customers said CW Entertainment did not give good value for money. That would be 0.01 per cent of all responses. Performance Indicator – 15 The percentage of customers satisfied with all services and facilities offered by CW Entertainment Q2 Performance Trend 96.29% 97.23% 100.00% 100.00% 92.00% 92.00% 80.00% 80.00% 60.00% 60.00% 40.00% 40.00% 20.00% 20.00% 0.00% 0.00% 2017/18 2018/19 2017/18 2018/19 Target Actual Target Actual Service Comments Customer satisfaction continues to remain high with an overall Net Promoter Score indicating most customers would actively promote CW Entertainment to others. This is supported by a current 4.5 out of 5 score on Trip Adviser and a similar rating on Google. CW Entertainment has also won the Welwyn GC BID award for ‘People's Favourite – the most family friendly venue’ in 2018. 3

  4. 07/11/18 Performance Indicator – 29 The maximum number of households living in temporary accommodation in the borough (where the council has a duty) Q2 Performance Trend 140 140 117 120 120 100 100 81 75 80 80 55 60 60 40 40 20 20 0 0 2017/18 2018/19 2017/18 2018/19 Target Actual Target Actual Service Comments The requirement for temporary accommodation for homeless households continues to exceed current capacity in our 2 sites, and we continue to draw on general needs housing stock to deal with some of the surplus (26 properties are now being used). Hotel/B&B is being used for 12 households that we don’t currently have suitable housing for. We are exploring other sites to be used as temporary accommodation, including the use of former sheltered accommodation that is scheduled for rebuilding, in order to initially reduce and finally remove the need to use hotels. Performance Indicator – 30 The number of Decent Homes assessments undertaken in properties in the private sector Q2 Performance Trend 160 160 136 140 140 125 112 120 120 100 100 100 80 80 60 60 40 40 20 20 0 0 2017/18 2018/19 2017/18 2018/19 Target Actual Target Actual Service Comments This is an excellent result as it represents 111% of year to date target and provides a solid foundation for achieving the annual target. The number of assessments will vary according to the amount of reactive and programmed inspections compared to the degree of proactive work to identify and confirm suspected HMO’s. 4

Download Presentation
Download Policy: The content available on the website is offered to you 'AS IS' for your personal information and use only. It cannot be commercialized, licensed, or distributed on other websites without prior consent from the author. To download a presentation, simply click this link. If you encounter any difficulties during the download process, it's possible that the publisher has removed the file from their server.

Recommend


More recommend