
SLIDE 1
Sole gas project: delivering transformational change David Maxwell - - PowerPoint PPT Presentation
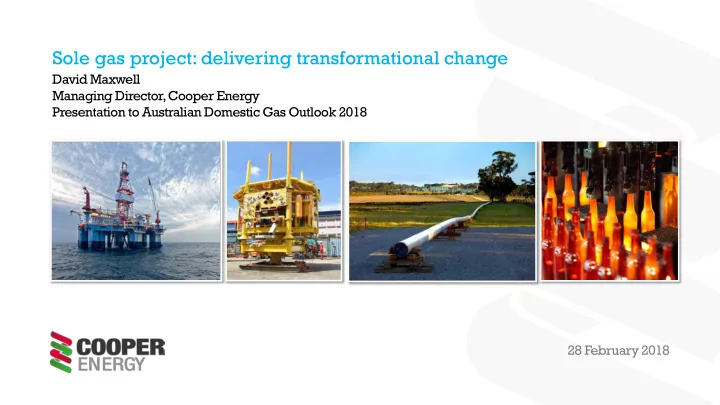
Sole gas project: delivering transformational change David Maxwell Managing Director, Cooper Energy Presentation to Australian Domestic Gas Outlook 2018 28 February 2018 Important Notice Disclaimer This presentation (Presentation) is
2
This presentation (“Presentation”) is issued by Cooper Energy Limited ABN 93 096 170 295 (“Cooper Energy” or “COE”). Summary information: This Presentation contains summary information about Cooper Energy and its activities as at the date of this Presentation and should not be considered to be comprehensive or to comprise all the information which a shareholder or potential investor in Cooper Energy may require in order to determine whether to deal in Cooper Energy shares. The information in this Presentation is a general background and does not purport to be
Not financial product advice: This Presentation is for information purposes only and is not a prospectus under Australian law (and will not be lodged with the Australian Securities and Investments Commission) or financial product
financial situation or needs of individuals. Before making an investment decision, prospective investors should consider the appropriateness of the information having regard to their own objectives, financial situation and needs and seek legal and taxation advice appropriate to their jurisdiction. Cooper Energy is not licensed to provide financial product advice in respect of Cooper Energy shares. Cooling off rights do not apply to the acquisition of Cooper Energy shares. Past performance: Past performance and pro forma historical financial information given in this Presentation is given for illustrative purposes only and should not be relied upon as (and is not) an indication of future performance. The historical information included in this Presentation is, or is based on, information that has previously been released to the market. Future performance: This Presentation may contain certain statements and projections provided by or on behalf of Cooper Energy with respect to anticipated future undertakings. Forward looking words such as, “expect”, “should”, “could”, “may”, “predict”, “plan”, “will”, “believe”, “forecast”, “estimate”, “target” and other similar expressions are intended to identify forward-looking statements within the meaning of securities laws of applicable jurisdictions. Indications of, and guidance on, future earnings, distributions and financial position and performance are also forward-looking statements. Forward-looking statements, opinions and estimates provided in this Presentation are based
including projections, forecasts, guidance on future earnings and estimates, are provided as a general guide only and should not be relied upon as an indication or guarantee of future performance. There can be no assurance that actual outcomes will not differ materially from these forward-looking statements. Qualified petroleum reserve and resources evaluator: This Presentation contains information on petroleum reserves and resources which is based on and fairly represents information and supporting documentation reviewed by Mr Andrew Thomas who is a full time employee of Cooper Energy holding the position of General Manager, Exploration & Subsurface, holds a Bachelor of Science (Hons), is a member of the American Association of Petroleum Geologists and the Society of Petroleum Engineers and is qualified in accordance with ASX Listing Rule 5.41 and has consented to the inclusion of this information in the form and context in which it appears. Reserves and Contingent Resources estimates: Information on the company’s reserves and resources and their calculation are provided in the appendices to this presentation. Investment risk: An investment in Cooper Energy shares is subject to investment and other known and unknown risks, some of which are beyond the control of Cooper Energy. None of Cooper Energy, any of its related bodies corporate or any other person or organisation guarantees any particular rate of return or the performance of Cooper Energy, nor do any of them guarantee the repayment of capital from Cooper Energy or any particular tax treatment. Not an offer: This Presentation is not and should not be considered an offer or an invitation to acquire Cooper Energy shares or any other financial products and does not and will not form any part of any contract for the acquisition of Cooper Energy shares. This Presentation does not constitute an offer to sell, or the solicitation of an offer to buy, any securities in the United States or to, or for the account or benefit of, any “U.S. person” (as defined in Regulation S under the US Securities Act of 1933, as amended (“Securities Act”)) (“U.S. Person”). Cooper Energy shares have not been, and will not be, registered under the Securities Act or the securities laws of any state or other jurisdiction of the United States, and may not be offered or sold in the United States or to any U.S. Person absent registration except in a transaction exempt from, or not subject to, the registration requirements of the Securities Act and any other applicable securities laws. This document may not be distributed or released in the United States or to any U.S. person. Rounding: All numbers in this presentation have been rounded. As a result, some total figures may differ insignificantly from totals obtained from arithmetic addition of the rounded numbers presented. Currency: All financial information is expressed in Australian dollars unless otherwise specified. P50 as it relates to costs is best estimate; P90 as it relates to costs is high estimate
3
Gas Processing Plant
1 Reserves and Contingent Resources at 25 August 2017 were announced to the ASX on 29 August 2017. The resources information displayed should be read in conjunction with the information
provided on the calculation of Reserves and Contingent Resources provided in the appendices to this document. The announcement included recognition of proved and probable reserves for the Sole gas field, the contingent resource for which was previously announced 27 February 2017.
4
Orbost Gas Processing Plant Works by APA Group Plant upgrade & operations Rig preparing to depart Fremantle for offshore Victoria
5
1 2 3 4 5 6 FY16 FY17 FY18 FY19 FY20
Forecast production MMboe
11 22 33 44 55 FY16 FY17 Sole FID
Proved & probable reserves MMboe
30 60 90 120 150 FY16 FY17 FY18 FY19 FY20
Estimated* operating cash flow $ million
* Average of analyst estimates for years FY18-FY20. Averages of analyst estimates displayed are not Cooper Energy estimates and accordingly should be regarded as indicative and not as company estimates.
Sole Other assets Sole Other assets Forecast for years Sole operating Current and previous years
6
0.0 14.0 20.0 20.0 20.0 20.0 20.0 20.0 20.0 15.5 13.0 3.5
2.4
10.0 3.9 3.9 3.9 4.0 3.9 3.9 3.9 8.5 10.9 3.4
FY19 FY20 FY21 FY22 FY23 FY24 FY25 FY26 FY27 FY28 FY29 FY30
Sole gas production PJ pa Uncontracted Contracted
7
8
9
10
Southern states* gas demand and production balance 2018 PJ
* Excludes Cooper Basin Source: ACCC Gas Inquiry 2017- 2020 Interim Report December 2017
Demand Centre Transportation ex- Wallumbilla Delivered prices using benchmark range Adelaide 1.85 7.72 - 9.70 Sydney 2.07 7.94 - 9.92 Melbourne 2.45 8.32 - 10.30 Gas flows Delivered 2018 gas prices A$/GJ at southern demand centres based on Queensland benchmark prices
Source: ACCC Gas Inquiry 2017- 2020 Interim Report December 2017 – which assumes US$6/mm Btu to US$7.50/mm Btu Asia LNG price
Forecast southern production shortfall 116 - 156 PJ
11
XXX YYY
Source: EnergyQuest EnergyQuarterly December 2017
12
Forecast gas supply (including Arrow Energy and Northern Territory) compared to forecast gas demand, East Coast Gas Market, 2020- 2030
Source: ACCC Gas Inquiry 2017 – 2020 Interim Report December 2017
more than 75% to come from undeveloped or new supply
(Adelaide) to $2.45/GJ (Melbourne)
supply for south-east Australia
gas from south-east Australia to market from 2021 on.
13
2018:
Trough: Dombey-1
supply from 2019
2019 & 2020:
Otway Hub Gippsland Hub 2018:
2019 & 2020:
Otway: offshore & onshore Gippsland
15
ACCC analysis of gas prices offered & accepted
Source: ACCC Gas Inquiry 2017 – 2020 Interim Report December 2017 Note: Offers up to 14 July are for annual quantities of at least 1 PJ; offers after this are for annual quantities of at least 0.5 PJ. Unfilled offers between 1 January 2017 and 14 July 2017 and all subsequent offers up to 9 November 2017 across the east coast gas market
20
30
50 2018 2019
Forecast eastern Australia gas demand supply balance 2018 – 2019 PJ
Base case Base + Max LNG prod. Source: ACCC Gas Inquiry 2017 – 2020 Interim Report December 2017
16
2 4 6 8 10 12 14
Casino-Henry Speculant-Halladale GBJV - incl. Kipper Thylacine-Geographe Sole-Manta Cooper Basin All QLD CSG - incl. LNG Amadeus Yolla Blacktip Beetaloo Petrel-Tern
Gas available for supply to Victoria, New South Wales, South Australia and Tasmania 2020 (TJ/day)
500 1,000 1,500
Delivered Melbourne city gate cost for gas from eastern Australia available for delivery to domestic market in 2020*
AUD / GJ
Source: EnergyQuest
infrastructure and anticipated to be available in 2020/21
1 South-east Australia comprises New South Wales, Victoria, South Australia and Tasmania 2 Cooper Energy estimate. Represents 75% percentile of 2016 daily gas flows
* Note: all estimates are as calculated by EnergyQuest and based on known capital expenditure to date, which may exceed cost to the current project owner(s).
Casino Henry Sole - Manta
Typical peak daily quantity for VIC/NSW/SA/TAS (2016)2 Average daily quantity for VIC/NSW/SA/TAS (2016)
17
Notes on Calculation of Reserves and Contingent Resources
Cooper Energy has completed its own estimation of reserves and resources in accordance with the definitions and guidelines in the Society of Petroleum Engineers (SPE) 2007 Petroleum Resources Management System (PRMS). All reserves and contingent resources figures in this document are net to Cooper Energy. Petroleum Reserves and Contingent Resources are prepared using deterministic and probabilistic methods based on information provided by the permit Operators Beach Energy Ltd, Senex Ltd, Santos Ltd, and BHP Billiton Petroleum (Victoria) P/L. Cooper Energy undertook the following analytical procedures to estimate the Reserves: independent interpretation of 3D seismic data; analysis of historical production data to assess accessed gas volumes and future production forecasts; review of the Operator’s reservoir and production simulation models to define raw gas recovery consistent with existing processing facilities; and independent probabilistic Monte Carlo statistical calculations to establish the range of recoverable gas. The resources estimate methodologies incorporate a range of uncertainty relating to each of the key reservoir input parameters to predict the likely range of outcomes. Project and field totals are aggregated by arithmetic summation by category. Aggregated 1P and 1C estimates may be conservative, and aggregated 3P and 3C estimates may be optimistic due to the effects of arithmetic summation. Totals may not exactly reflect arithmetic addition due to rounding. The information contained in this report regarding the Cooper Energy reserves and contingent resources is based on, and fairly represents, information and supporting documentation reviewed by Mr Andrew Thomas who is a full-time employee of Cooper Energy Limited holding the position of General Manager Exploration & Subsurface, holds a Bachelor of Science (Hons), is a member of the American Association of Petroleum Geologists and the Society of Petroleum Engineers, is qualified in accordance with ASX listing rule 5.41, and has consented to the inclusion of this information in the form and context in which it appears.
Reserves
Under the SPE PRMS, reserves are those petroleum volumes that are anticipated to be commercially recoverable by application of development projects to known accumulations from a given date forward under defined conditions. Reserves at 25 August 2017 were announced to the ASX on 29 August 2017. The Otway Basin totals comprise the arithmetically aggregated project fields (Casino-Henry-Netherby and Minerva) and exclude reserves used for field fuel. The Cooper Basin totals comprise the arithmetically aggregated PEL 92 project fields and the arithmetic summation of the Worrior project reserves, and exclude reserves used for field fuel. The Gippsland Basin total comprise Sole field only and is net of fuel gas.
Contingent Resources
Under the SPE PRMS, contingent resources are those petroleum volumes that are estimated, as of a given date, to be potentially recoverable from known accumulations but for which the applied projects are not considered mature enough for commercial development due to one or more contingencies. The Contingent Resources at 25 August 2017 assessment includes resources in the Gippsland, Otway and Cooper basins and were announced to the ASX on 29 August 2017 Cooper Energy is not aware of any new information or data that materially affects the information provided in those releases, and all material assumptions and technical parameters underpinning the estimates provided in the releases continue to apply.