SOCA F Field eld House a at B Belved eder ere A Home for All - - PowerPoint PPT Presentation
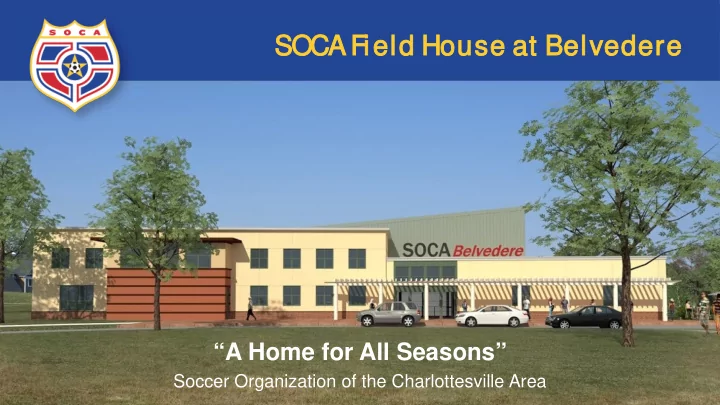
SOCA F Field eld House a at B Belved eder ere A Home for All Seasons Soccer Organization of the Charlottesville Area Introduction to SOCA Largest Local Community Sports Organization 501(c)3 Not-For-Profit Founded in 1982,
Introduction to SOCA
- Largest Local Community
Sports Organization
- 501(c)3 Not-For-Profit
- Founded in 1982, Charlottesville
- $2.48 Million Annual Operating Budget
- 2014, Merged with Augusta FC
- 13,000 Annual Registrations
2
Inclusive
All welcome - Young to Old, Novice to Expert
3
Comprehensive
Elite Travel
SOCA (16) 250
Classic Travel
Augusta (2 Teams) 30 Players Charlottesville (14 Teams) 200 Players
Challenge Advanced Recreational
Charlottesville (54 Teams) 650 Players
Recreation and Hot Shots
Augusta (44 Teams) 550 Players and (8 Teams) 80 Players = 630 Players Charlottesville (155 Teams) 1900 Players and (48 Teams) 500 Players = 2400 Players
250 Players U18-U11 360 Players U18-U11 Premier Travel
Augusta(9 Teams)160 Players Charlottesville (14 Teams)200 Players
230 Players U18-U11 650 Players U14-U9 3030 Players U18-U5 SOCA’s Youth Participation is 59% Male and 41% Female
SOCA Main Youth Program Pyramid
Supplemental Programs 750 Annual Registrations Adult Programs 3225 Annual Registrations C-ville Winter Indoor Programs 1670 Annual Registrations
4
Weekend Snapshot
- 5500 Local Players
- 400 Teams
- 700 Coaches
- 240 Games Played Each Weekend
- 50 Different Game Fields Managed
- 250 Referee Assignments
SOCA U16 Boys - 2011 State Cup Champions
5
Market Penetration
SOCA Charlottesville Region Baseball/Softball Charlottesville Area 9 Organizations Virginia Youth Soccer Association Statewide Lacrosse Charlottesville Area 3 Organizations Football Charlottesville Area 3 Organizations
21% 11% 10% 6% 3% S O C A
Percentage of Youth Participation, Age 5-18
6
Outreach Program
- $100,000 annual financial
assistance grants
- 5% of SOCA’s total annual
budget
- Includes 120 players annually
from under served communities
- 642 total financial assistance
awards in 2014
7
Over Achieving
.179
Winning Percentage / Population
S O C A
Club Winning % Per Population Base: Fall 2014 CCL Results
.161 .153 .150 .129 .050 .058 .079 .084 .090 .096 .101 9 .102 .107 .108 .122
Loudoun BRYC Arlington SA DC Stoddert FC Frederick Beach FC Maryland United Potomac SA McLean YS Fredericksburg FC Roanoke Star SYA-NOVA FC Richmond VA Legacy Annandale United
8
$823 $1,406 $0 $400 $800 $1,200 $1,600
Affordability
SOCA compared to: FC Richmond, Beach FC, Fredericksburg FC, Virginia Legacy, Richmond Strikers, Richmond Kickers
U18-U15 Fees
SOCA = 41% Less
Annual Youth Travel Soccer Fee Comparison
U14-U11 Fees
SOCA = 27% Less
A V E R A G E
S O C A
$1,128 $1,538 $0 $400 $800 $1,200 $1,600
A V E R A G E
S O C A
9
Fiscal Budget
SOCA Budget: 1,019% Growth Over 21 Years!
$0 $500,000 $1,000,000 $1,500,000 $2,000,000 $2,500,000 1994 1995 1996 1997 1998 1999 2000 2001 2002 2003 2004 2005 2006 2007 2008 2009 2010 2011 2012 2013 2014 2015
Club Growth: Players = 223% Programs = 446% Staffing = 800%
10
Staff Compensation 23% Coaching 12% South Fork Soccer Park 10% Gym/ Field Rent & Maintenance 9% Uniforms 7% Referees 7% Youth/Adult League/Assoc. Expenses 7%
- Admin. Operating
Expenses 5% Tournament Registration 5% Marketing, Communications 4% Professional Services 2% Equipment 2% Field Development Transfer 2% Other 5%
Fiscal Budget
Travel Program Fees 31% Recreational/ Hot Shot Fees 21% Challenge Program Fees 14% Adult Program Fees 11% Camps/ Clinics/ Youth WISL 11% Other Program Fees 6% Sponsorship, Donations, Grants 6%
SOCA Income Sources: 2014 SOCA Major Expenses: 2014
11
Field Facts
- No Soccer-Specific
Indoor Facilities
- No Lit Soccer-Specific Fields
- No All-Weather Soccer-
Specific Fields
- Local deficiency of suitable
soccer fields, putting continual pressure on existing fields.
12
Unsuitable Facilities
13
Overuse
- 240 Games/50 fields =
5 Games/day +/-
- Grass Fields Used 250%
Above Recommended Level
- Field House = 3 Outdoor Fields
14
Solutions - SFSP
- 6 Fields, $1 Million Project
- Successfully Built, Operated
& Managed
- Great Fields, but Not Enough
- Subject to Weather Closings
15
Solutions - Belvedere
PHASE 1
Field House
Indoor Field and Supporting Spaces
Status: Ready for Development Budget: $5,280,198 Timeline: Winter 2017
PHASE 2
Stadium
Lit, All-Weather, Full-Size Field
Status: Property under agreement Budget: $2,800,000 Timeline: Fall 2018
PHASE 3
Soccer Park
4 Grass, Championship Quality Fields
Status: Property under agreement Budget: $1,100,000 Timeline: Fall 2020
$9.18 Million Total Campus Development Budget
16
17
Solutions-Belvedere
Solutions – Field House
18
Solutions – Field House
19
Solutions – Field House
20
Solutions – Field House
21
Solutions – Field House
22
Use & Users
Existing Programs
- Winter: Entire Indoor, Youth & Adult
- Summer: Camps, Clinics
- Fall/Spring: U-1O Games, Practices, Clinics
New Options
- Youth & Adult Tourny Series
- Mid-Week Adult Leagues
- Summer High School League
- Open Gym, Rentals
Coach Education Referee Training Families!
23
Solutions – Field House Financials
Operating Budget
- $162,000 Annual Operating Budget
- $168,000 projected income from new program offerings, increased
enrollment and fees in existing programs, field rental and sponsorships. Capital Funding
- Debt service funded by: reallocating existing expenditures for gym and
- ffice rental, field development transfer, annual campaign funds, and fees.
- $82,000 spent annually on existing rentals. $44,000 annual field
development transfer.
24
Solutions – Field House Budget
- Capital Campaign Budget:
$5.3 Million
- Loan: $3.5 Million
- Completed or Pledged: $887,000
- Campaign Remaining: $913,000
- Compare $96/sq. ft. vs $163/sq. ft.
for UVa Indoor Football Field
- Status: Approved!
Bid Documents Prepared
25
Partnership Opportunity
- Naming Rights
- Lead Gifts
- Giving Plan
- Challenge, Matching Grants
- Gifts-In-Kind
26