soca f field eld house a at b belved eder ere
play

SOCA F Field eld House a at B Belved eder ere A Home for All - PowerPoint PPT Presentation

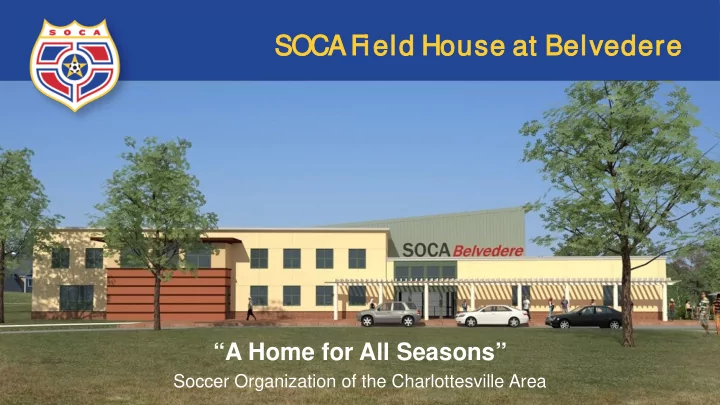
SOCA F Field eld House a at B Belved eder ere A Home for All Seasons Soccer Organization of the Charlottesville Area Introduction to SOCA Largest Local Community Sports Organization 501(c)3 Not-For-Profit Founded in 1982,


  1. SOCA F Field eld House a at B Belved eder ere “A Home for All Seasons” Soccer Organization of the Charlottesville Area

  2. Introduction to SOCA • Largest Local Community Sports Organization • 501(c)3 Not-For-Profit • Founded in 1982, Charlottesville • $2.93 Million Annual Operating Budget • 2014 - Merged with Augusta FC • 13,000 Annual Registrations • 7300 Unique Players Each Year 2

  3. Inclusive All welcome - Young to Old, Novice to Expert 3

  4. Comprehensive SOCA Main Youth Program Pyramid Elite 280 Players Supplemental Programs Travel U18-U11 SOCA (18) 280 750 Annual Registrations Premier Travel 410 Players Augusta(11 Teams)170 Players Adult Programs Charlottesville (16 Teams)240 Players U18-U11 3225 Annual Registrations Classic Travel 290 Players Augusta (3 Teams) 40 Players C-ville Winter Indoor Programs U18-U11 Charlottesville (18 Teams) 250 Players 1670 Annual Registrations Challenge - Advanced Recreational 700 Players Augusta (5 Teams) 50 Players U14-U9 Charlottesville (54 Teams) 650 Players Recreation and Hot Shots 3200 Players Augusta (55 Teams) 650 Players and (15 Teams) 150 Players = 800 Players U18-U5 Charlottesville (155 Teams) 1900 Players and (48 Teams) 500 Players = 2400 Players SOCA’s Youth Participation is 59% Male and 41% Female 4

  5. Weekend Snapshot • 5500 Local Players • 400 Teams • 700 Coaches • 240 Games Played Each Weekend • 50 Different Game Fields Managed • 250 Referee Assignments SOCA U17 Boys - 2016 Virginia State Cup Champions 5

  6. Market Penetration Percentage of Youth Participation, Age 5-18 21% S 11% 10% O 6% C 3% A Virginia Youth SOCA Baseball/Softball Lacrosse Football Soccer Association Charlottesville Charlottesville Area Charlottesville Area Charlottesville Area Statewide Region 9 Organizations 3 Organizations 3 Organizations 6

  7. Outreach Program • $125,000 annual financial assistance grants • 4% of SOCA’s total annual budget • Includes 130 players annually from under served communities • 700 total financial assistance awards in 2017 7

  8. Over Achieving Club Winning % Per Population Base: Fall 2016 CCL Results Fredericksburg FC Loudoun Arlington SA Maryland United DC Stoddert FC Frederick BRYC Potomac SA .179 McLean YS Winning Percentage / Population .161 Roanoke Star .153 .150 .129 SYA-NOVA S .122 FC Richmond Annandale United .108 Beach FC .107 .102 .101 VA Legacy O .096 9 .090 C .084 .079 A .058 .050 8

  9. Affordability Annual Youth Travel Soccer Fee Comparison $1,561 $1,600 $1,600 $1,456 A $1,200 $1,116 A $1,200 V V E E $779 S $800 $800 R S R O A O A C $400 G $400 G C A E E A $0 $0 U18-U15 Fees U14-U11 Fees SOCA = 29% Less SOCA = 46% Less SOCA compared to: FC Richmond, Beach FC, Fredericksburg FC, Virginia Legacy, Richmond Strikers, Richmond Kickers 9

  10. Fiscal Budget SOCA Budget: 1,241% Growth Over 23 Years! $3,000,000 $2,500,000 $2,000,000 $1,500,000 $1,000,000 $500,000 $0 1994 1995 1996 1997 1998 1999 2000 2001 2002 2003 2004 2005 2006 2007 2008 2009 2010 2011 2012 2013 2014 2015 2016 2017 Club Growth: Players = 223% Programs = 446% Staffing = 800% 10

  11. Fiscal Budget Equipment Other Marketing 2% Other 2% 2% Tournaments, 3% Travel Leagues Professional 6% Services 4% Adult Program Fees Staff Compensation 10% Travel Uniforms 22% Program 5% Fees 32% Camps/ Clinics/ Admin/Operating Youth WISL 6% 10% Coaching 12% Referees Sponsors, 6% League Registration Donations, Recreational/ 6% Grants Gym / Field Hot 11% Rent Tournament Shot Fees Challenge 9% Registration 18% Program Fees 7% Facility 11% Development Field Prep 8% 8% SOCA Income Sources: 2017 11 SOCA Major Expenses: 2017

  12. Field Facts • No Soccer-Specific Indoor Facilities • No Lit Soccer-Specific Fields • No All-Weather Soccer- Specific Fields • Local deficiency of suitable soccer fields, putting continual pressure on existing fields. 12

  13. Unsuitable Facilities 13

  14. Overuse • 240 Games/50 fields = 5 Games/day +/- • Grass Fields Used 250% Above Recommended Level • Field House = 3 Outdoor Fields 14

  15. Solutions - SFSP • 6 Fields, $1 Million Project • Successfully Built, Operated & Managed • Great Fields, but Not Enough • Subject to Weather Closings 15

  16. Solutions - Belvedere PHASE 1 PHASE 2 PHASE 3 Field House Stadium Soccer Park Indoor Field Lit, All-Weather, 4 Grass, Championship and Supporting Spaces Full-Size Field Quality Fields Status : Ready for Development Status : Property under agreement Status : Property under agreement Budget : $5,582,211 Budget : $2,800,000 Budget : $1,100,000 Timeline : Winter 2020 Timeline : Fall 2021 Timeline : Fall 2023 $9.48 Million Total Campus Development Budget 16

  17. Solutions-Belvedere 17

  18. Solutions – Field House 18

  19. Solutions – Field House 19

  20. Solutions – Field House 20

  21. Solutions – Field House 21

  22. Solutions – Field House 22

  23. Use & Users Existing Programs • Winter: Entire Indoor, Youth & Adult • Summer: Camps, Clinics • Fall/Spring: U-1O Games, Practices, Clinics New Options • Youth & Adult Tourny Series • Mid-Week Adult Leagues • Summer High School League • Open Gym, Rentals Coach Education Referee Training Families! 23

  24. Solutions – Field House Financials Operating Budget • $162,000 Annual Operating Budget for Facility • $168,000 projected income from new program offerings, increased enrollment and fees in existing programs, field rental and sponsorships. Capital Funding • Debt service funded by: reallocating existing expenditures for gym and office rental, field development transfer, annual campaign funds, and fees. • $120,000 spent annually on existing rentals. $130,000 annual field development transfer. 24

  25. Solutions – Field House Budget • Current Capital Campaign Budget: $4.7 Million – June 1, 2018 • Loan: $3.5 Million • Cash in Hand: $725,000 – June 1 • Cash Pledged: $75,000 – June 1 • Campaign Remaining: $400,000 • Compare $96/sq. ft. vs $163/sq. ft. for UVa Indoor Football Field • Status: Site Work Beginning 2018 25

  26. Matching Challenge Grant • SOCA issued $200K Challenge Grant by Perry Foundation. • Must raise entire $200K with either new donations or Pledges by December 5. • $60K Raised as of October 1. • New Additional Match Now Offered as of October 1 for $150K! • If SOCA raises $200K, will now receive an additional $350K for $550K Total! • Each donation for the remainder of the campaign will be tripled. $100 = $300 • All donors of $250 or greater receive a SOCA Scarf. • Donors above $1000 receive recognition on the Donor Wall in the new facility. 26

  27. Partnership Opportunity • Naming Rights • Lead Gifts • Giving Plan • Challenge, Matching Grants • Gifts-In-Kind 27

  28. SOCA Thanks You For Your Support

Download Presentation
Download Policy: The content available on the website is offered to you 'AS IS' for your personal information and use only. It cannot be commercialized, licensed, or distributed on other websites without prior consent from the author. To download a presentation, simply click this link. If you encounter any difficulties during the download process, it's possible that the publisher has removed the file from their server.

Recommend


More recommend