
Creating a Business Analytics Class: Furman's Experience 17 Nov 2013 2013-Karwan-DSI-MSMESB-Slides.pdf 1
Creating a Business Analytics Class: Furman’s Experience
Kirk Karwan Department of Business & Accounting Furman University
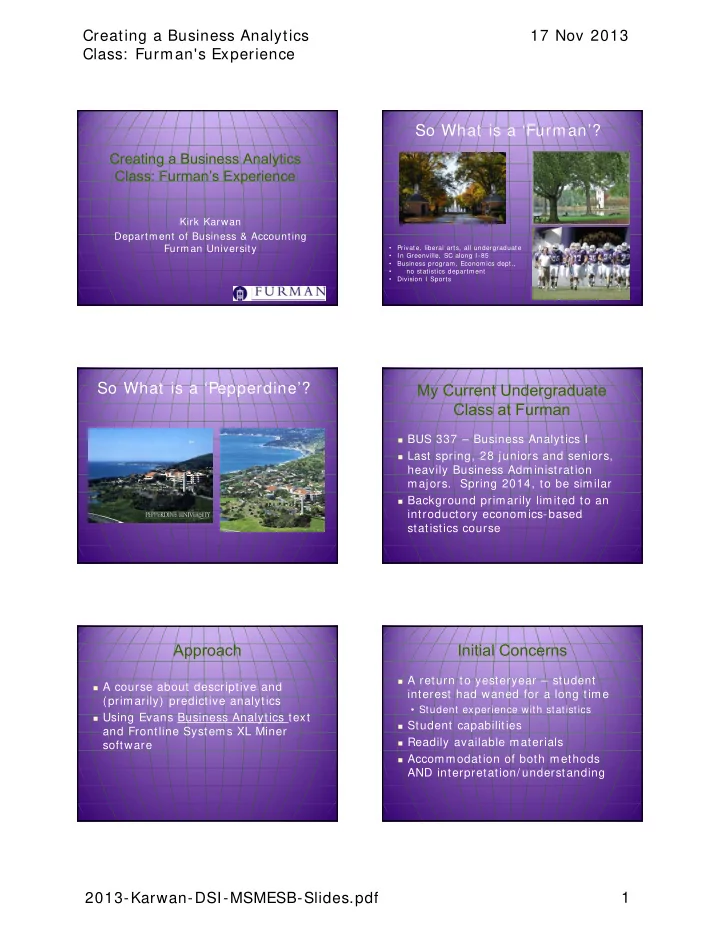
So What is a ‘Furman’?
- Private, liberal arts, all undergraduate
- In Greenville, SC along I-85
- Business program, Economics dept.,
- no statistics department
- Division I Sports
So What is a ‘Pepperdine’? My Current Undergraduate Class at Furman
BUS 337 – Business Analytics I Last spring, 28 juniors and seniors,
heavily Business Administration
- majors. Spring 2014, to be similar
Background primarily limited to an
introductory economics-based statistics course
Approach
A course about descriptive and
(primarily) predictive analytics
Using Evans Business Analytics text
and Frontline Systems XL Miner software
Initial Concerns
A return to yesteryear – student
interest had waned for a long time
- Student experience with statistics
Student capabilities Readily available materials Accommodation of both methods
AND interpretation/ understanding