
SLIDE 1
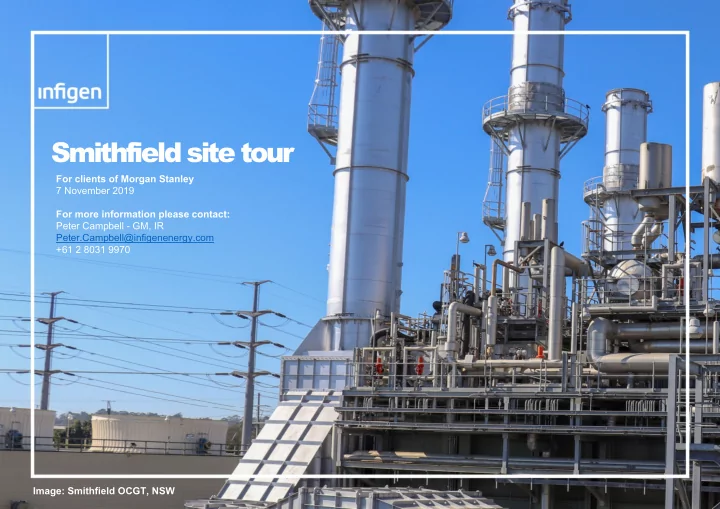
Image: Smithfield OCGT, NSW
Smithfield site tour
For clients of Morgan Stanley 7 November 2019 For more information please contact: Peter Campbell - GM, IR Peter.Campbell@infigenenergy.com +61 2 8031 9970
Smithfield site tour For clients of Morgan Stanley 7 November 2019 - - PowerPoint PPT Presentation
Smithfield site tour For clients of Morgan Stanley 7 November 2019 For more information please contact: Peter Campbell - GM, IR Peter.Campbell@infigenenergy.com +61 2 8031 9970 Image: Smithfield OCGT, NSW Agenda Management presentation
Image: Smithfield OCGT, NSW
For clients of Morgan Stanley 7 November 2019 For more information please contact: Peter Campbell - GM, IR Peter.Campbell@infigenenergy.com +61 2 8031 9970
2
3
557MW
Owned Renewable Energy Assets
Nil
Contracted Renewable Energy Assets
Nil
Firming Assets
647GWh
C&I electricity sales
‘Owner operator of wind farms’ FY18
670MW
Owned Renewable Energy Assets
89MW
Contracted Renewable Energy Assets
268MW*
Firming Assets
768GWh
C&I electricity sales
‘Utility of the future’ Today
Source an additional 600-700MW
Fast-start firming enables 75% of expanded renewable energy volumes to be contracted. Progress Flyers Creek Wind Farm to final investment decision. Continual improvement of quality and quantity of earnings.
Our plan for growth We are leading Australia’s transition to a clean energy future
* Including South Australian Gas Turbines (120MW) where lease is expected to commence in May 2020.
4
Safety
monthly safety meetings and process audit.
Developing an engaged and high performance workforce
business strategy.
female.
Investing in our local communities
local jobs during construction.
Targeting carbon neutrality
5
Net Revenue: $229.3m, 9% higher than FY18. Underlying EBITDA: $165.3m, 11% higher than FY18. NPAT: $40.9m, 10% lower than FY18. FY19 included non-cash $9.9m impairment to development assets, announced December 2018. Net operating cash flow: $144.3m, 44% higher than FY18. Renewable Energy Generation sold: 1,775GWh, 20% higher than FY18. Reintroduced distributions: 1 cent per security per half year.
Notes: Contracted Revenue includes electricity revenue from PPAs, electricity revenue from C&I customers and contracted LGC revenue. Uncontracted Revenue incudes Merchant revenue and uncontracted LGC
161.6 182.0 48.4 37.2 0.1 10.1 50 100 150 200 250 FY18 FY19
AUD m
Net Revenue FY18 vs FY19
Contracted Revenue Uncontracted Revenue Compensated Revenue Contracted Revenue +13% Net Revenue +9%
6
0 GWh 500 GWh 1000 GWh 1500 GWh 2000 GWh 2500 GWh 3000 GWh 3500 GWh 4000 GWh 4500 GWh FY17 FY18 FY19 FY20 FY21 FY22 FY23 FY24 FY25
The opportunity
PPA C&I and Wholesale C&I opportunity Merchant
Volume
Contracting
Together with Smithfield OCGT and the SA Battery, the SAGTs position Infigen for a total of 600-700MW renewable capacity growth with up to 75% of the expanded renewable energy generation to be contracted.
Note: Based on expected Renewable Energy Generation adjusted for FY20 Marginal Loss Factors; includes contracted supply from Kiata WF, includes Cherry Tree WF from FY21; excludes firming assets; statistical simulation basis.
0 GWh 500 GWh 1000 GWh 1500 GWh 2000 GWh 2500 GWh 3000 GWh 3500 GWh 4000 GWh 4500 GWh FY17 FY18 FY19 FY20 FY21 FY22 FY23 FY24 FY25
Infigen's current contracting position
PPA C&I and Wholesale Merchant
Note: Chart shows indicative volume growth and indicative contracting levels enabled by Infigen’s firming strategy. Actual outcomes are dependent on timing of additional Capital Lite generation and execution of C&I contracting. Chart illustrative of the opportunity and is not guidance. Based on expected Renewable Energy Generation adjusted for FY20 Marginal Loss Factors; includes contracted supply from Kiata WF; includes Cherry Tree WF from FY21; excludes firming assets; statistical simulation basis. Actual outcomes will be dependent on timing of additional Capital Lite generation and execution of C&I contracting.
7
Renewable Energy Firming Reliable Clean Energy We generate and source renewable energy We add value by firming We provide our customers with reliable clean energy We are leading Australia’s transition to a clean energy future
8
South Australia Gas Turbines South Australia Battery Smithfield OCGT, NSW
May 2020
expected H1FY20.
with up to 75% of the expanded generation able to be contracted.
600-700MW of additional renewable energy capacity with up to 75% generation able to be contracted.
9
(“OCGT”) in NSW.
totalling 123MW, providing operational flexibility.
National Electricity Market (“NEM”).
Smithfield Open Cycle Gas Turbine, NSW
10
acquisition.
‘Merchant’.
May to 28th October 2019.
0.0% 2.0% 4.0% 6.0% 8.0% 10.0% 12.0% 14.0% 16.0% 18.0% 5 10 15 20 25 30 35
27/05/2019 3/06/2019 10/06/2019 17/06/2019 24/06/2019 1/07/2019 8/07/2019 15/07/2019 22/07/2019 29/07/2019 5/08/2019 12/08/2019 19/08/2019 26/08/2019 2/09/2019 9/09/2019 16/09/2019 23/09/2019 30/09/2019 7/10/2019 14/10/2019 21/10/2019 28/10/2019
Capacity Factor Number of unit starts
Number of Starts and Capacity Factor by week since acquisition
Number of starts Capacity Factor
11
Established portfolio of long life renewable energy assets with 670MW of owned capacity. Growing portfolio of Capital Lite renewable energy assets. Portfolio of flexible, fast-start firming assets. Proven Commercial and Industrial (C&I) customer capability. Long dated Operations and Maintenance agreements for wind assets delivering high availability. Experienced leadership and high performance team. Track record of delivering wide EBITDA margins.
13
Purchase Price comparables:
$74m for 123MW, equivalent to $600/kW.
These are significantly less than a new entrant OCGT at ~$1050/kW or a reciprocating engine at ~$1400/kW.
On a CCGT basis, equivalent to $445/kW, significantly less than new entrant CCGT at ~$1500/k. Value considerations:
Heat Rate c12.5 GJ/MWh at full load.
Capacity Factor: 2-8% with higher electricity prices resulting in increasing capacity utilisation.
Remaining useful life: 20-30 years depending on utilisation, start ups and end
Lease: 20 year at $0.52m pa, (annual escalation at higher of 3.25% and CPI). In addition, 4x 5-year market rent renewal options.
Budgeted remediation: Unless otherwise agreed with landowner, Infigen will remove the plant from the site at the end of the lease.
Snowy 2.0: Infigen assumed that it will be built; that it will operate commercially and that it will, as it states in its business case, not of itself be sufficient to support the growth of renewables in the NEM.
Other Physical Firming Projects:
away from customer load. Snowy 2.0 is approximately $2000/kW vs Smithfield around $600/kW (on 123MW price basis). Revenue Considerations
Revenue split between Cap contract sales and the firming of Infigen’s
If used solely for $300/MWh Cap Contract sales (i.e. the ‘always available’ option), then Smithfield Acquisition is expected to exceed Infigen’s post tax levered equity return hurdle of 12%.
Growth opportunity involves firming Infigen’s owned or sourced “MWh” rather than selling Caps, which creates additional value.
Positions Infigen to comply with Retailer Reliability Obligation. Upside potential beyond base case assumptions
Able to reconfigure to CCGT (180MW):
CCGT is likely to make commercial sense.
inspection within 24 months of commissioning. Operations Protocol
Cap Contract sales for up to 2 units.
1 unit for high price events (i.e. when price is higher than Smithfield’s SRMC).
Gas Supply
Infigen will purchase gas on the STTM spot market on an ‘as used’ basis.
Smithfield SRMC ranges between ~$100 - $150/MWh.
In the short term, STTM prices are not correlated to NEM critical event days.
STTM is Sydney’s major high pressure city-gate gas hub.
This provides a reliable gas supply without entering a “take or pay” contract.
Co-located site partner (Visy) will manage Infigen’s gas purchasing and transport arrangements for a transitional period. Gas Transport
Gas is transported from the Horsley Park STTM delivery point to Smithfield via a dedicated 10km Jemena pipeline (the Horsely Park-Smithfield lateral).
For modelling purposes, gas transportation costs are around $0.5/GJ. Correlation between average gas prices and base electricity prices
STTM gas prices are not correlated to electricity prices on critical electricity event days in NSW.
However, over the medium term, gas prices have fed into electricity market prices.
Average gas prices correlate with base load electricity prices, providing a natural hedge for Infigen.
Connection to the STTM means gas is readily available.
Source: GMAT, Infigen
14
0% 5% 10% 15% 20% 25% 20 40 60 80 100 120 140 160 180 8.1 8.3 8.6 8.8 9.1 9.3 9.5 9.8 10.0 10.2 10.5 10.7 10.9 11.2 11.4 11.6 11.9 12.1 12.4 12.6
Frequency of gas price (%) SRMC ($/MWh) STTM gas price ($/GJ)
Smithfield SRMC and typical gas prices
Frequency of gas price in FY19 (RHS) Estimated SRMC (LHS)
0.0 2.0 4.0 6.0 8.0 10.0 12.0 0.00 20.00 40.00 60.00 80.00 100.00 120.00 140.00 Mar-11 Jun-11 Sep-11 Dec-11 Mar-12 Jun-12 Sep-12 Dec-12 Mar-13 Jun-13 Sep-13 Dec-13 Mar-14 Jun-14 Sep-14 Dec-14 Mar-15 Jun-15 Sep-15 Dec-15 Mar-16 Jun-16 Sep-16 Dec-16 Mar-17 Jun-17 Sep-17 Dec-17 Mar-18 Jun-18 Sep-18 Dec-18 Mar-19 Jun-19
STTM gas price ($/GJ) NEM price ($/MWh)
Quarter ending
Correlation between NEM price and gas price
Weighted NEM price Average NEM gas price
Source: AEMO, AER Source: AEMO, Infigen
Dispatch of Smithfield OCGT
Infigen expects to operate Smithfield OCGT if prices are higher than its SRMC.
12-13 minute start time. Idling capacity offers additional flexibility.
Dispatch is managed by Infigen’s existing 24 hour control room and site management. Operations and Maintenance
Experienced team of on site operators have been integrated as Infigen employees.
Facility in excellent condition, maintained in accordance with OEM regime.
Unit 1 will undergo a major inspection and upgrade in FY21.
Future maintenance expenditures will vary depending on asset use. More frequent starts and higher utilisation bring forward maintenance expenditure, but imply higher electricity prices.
Further major services not expected until beyond 2030 with approximately $3m of cumulative maintenance from 2025-2030.
High voltage interconnector capacity of 208MW, well in excess of plant capacity.
Note: part of maintenance costs will be expensed for accounting purposes.
15
0.0 1.0 2.0 3.0 4.0 5.0 6.0 7.0
Fixed costs (real $m)
Projected site fixed costs and capital expenditure
Site costs Site lease Maintenance Transitional costs
16
“The cheapest way to replace generation capacity will be a portfolio of solar, wind and power storage complemented by flexible gas fired power plants.” AEMO Integrated System Plan 2018 "As thermal plants retire and variable renewables increase… new flexible capacity will be needed and there are limits to what renewables and batteries can do together…We expect peaker gas to grow by almost a factor of four by 2050.” Bloomberg NEF, New Energy Outlook 2018 “Firm or dispatchable power is a generator that… can be adjusted up and down when the wind dips and the sun stops shining…Less flexible ‘baseload’ generators – such as coal and nuclear – cannot adjust from off to flat out, to off again. The more renewables are used, the more flexible the firm generation needs to be.” “Black Out”, Matthew Warren, 2019, p141
South Australia Battery at Lake Bonney, SA Smithfield OCGT, NSW
17
Alinta WF Lake Bonney 1 WF Lake Bonney 2 WF Lake Bonney 3 WF Capital WF Woodlawn WF Bodangora WF Kiata PPA Cherry Tree PPA Asset type Wind Farm Wind Farm Wind Farm Wind Farm Wind Farm Wind Farm Wind Farm Offtake (PPA), electricity only, from third party wind farm Offtake (PPA), electricity and LGCs, from third party wind farm Ownership Structure 100% 100% 100% 100% 100% 100% 100% 0%, Capital Lite 0%, Capital Lite Location Geraldton, WA Millicent, SA Millicent, SA Millicent, SA Bungendore, NSW Tarago, NSW Wellington, NSW Horsham, Victoria Seymour, Victoria Capacity (MW) 89.1 80.5 159.0 39.0 140.7 48.3 113.2 31.0 57.6 Expected (P50) Capacity Factor 41.1% 26.2% 27.1% 27.0% 28.3% 34.3% 35.6% 47.3% 36.3% FY19 Marginal Loss Factor 0.9475 0.9144 0.9144 0.9144 1.0100 1.0100 0.9819 0.9911 NA FY20 Marginal Loss Factor 0.9447* 0.9777 0.9777 0.9777 0.9701 0.9701 0.9495 0.9066 NA Expected (P50) Generation Sold (based on FY20 MLF) 321 181 369 90 338 141 335 116 177 Commenced operation Jul-06 Mar-05 Sep-08 Jul-10 Jan-10 Oct-11 Feb-19 NA ~2020 Depreciable life end date Jul-31 Mar-30 Sep-33 Jul-35 Jan-35 Oct-36 Feb-49
15 years from completion O&M contract end date Dec-25 Dec-24 Dec-27 Dec-29 Dec-30 Dec-32 Feb-39 NA NA Cost of supply Share of operating expenses Confidential PPA price Confidential PPA price *At Alinta WF Marginal Loss Factor is only applicable to LGCs. Electricity is sold before application of MLF.
18
This publication is issued by Infigen Energy Limited (“IEL”) and Infigen Energy Trust (“IET”), with Infigen Energy RE Limited (“IERL”) as responsible entity of IET (collectively “Infigen”). Infigen and its related entities, directors, officers and employees (collectively “Infigen Entities”) do not accept, and expressly disclaim, any liability whatsoever (including for negligence) for any loss howsoever arising from any use of this publication or its contents. This publication is not intended to constitute legal, tax or accounting advice or opinion. No representation or warranty, expressed or implied, is made as to the accuracy, completeness or thoroughness of the content of this publication. The recipient should consult with its own legal, tax or accounting advisers as to the accuracy and application of the information contained herein and should conduct its own due diligence and other enquiries in relation to such information. The information in this presentation has not been independently verified by the Infigen Entities. The Infigen Entities disclaim any responsibility for any errors or
Infigen Entities that any projection, forecast, calculation, forward-looking statement, assumption or estimate contained in this presentation should or will be
IEL is not licensed to provide financial product advice. This publication is for general information only and does not constitute financial product advice, including personal financial product advice, or an offer, invitation or recommendation in respect of securities, by IEL or any other Infigen Entities. Please note that, in providing this presentation, the Infigen Entities have not considered the objectives, financial position or needs of the recipient. The recipient should obtain and rely on its own professional advice from its tax, legal, accounting and other professional advisers in respect of the recipient’s objectives, financial position or needs. This presentation does not carry any right of publication. Neither this presentation nor any of its contents may be reproduced or used for any other purpose without the prior written consent of the InfigenEntities. IMPORTANT NOTICE Nothing in this presentation should be construed as either an offer to sell or a solicitation of an offer to buy Infigen securities in the United States or any other jurisdiction. Securities may not be offered or sold in the United States or to, or for the account or benefit of, US persons (as such term is defined in Regulation S under the US Securities Act of 1933) unless they are registered under the Securities Act or exempt from registration.