
SLIDE 1
13th IWA Specialized Conference on Small Water and Wastewater Systems
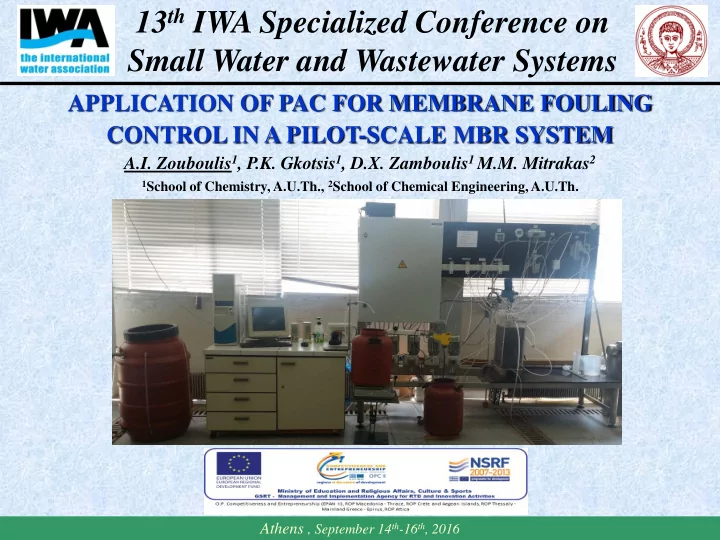
APPLICATION OF PAC FOR MEMBRANE FOULING CONTROL IN A PILOT-SCALE MBR SYSTEM
A.I. Zouboulis1, P.K. Gkotsis1, D.X. Zamboulis1 M.M. Mitrakas2
1School of Chemistry, A.U.Th., 2School of Chemical Engineering, A.U.Th.
Athens , September 14th-16th, 2016