Small Hydropower Potential Assessment using Remote Sensing and - - PDF document

small hydropower potential assessment using remote
SMART_READER_LITE
LIVE PREVIEW

Small Hydropower Potential Assessment using Remote Sensing and - - PDF document

Jan-Philipp Grett and Torsten Fay Small Hydropower Potential Assessment using Remote Sensing and Hydrological Data The hydroMinds Model. Technical Report and Model Presentation. Identifjcation of new renewable energy resources is of crucial


slide-1
SLIDE 1

1 Background and Data Requirements

Water courses suitable for hydropower generation have sustainable and ideally high fmow rates as well as steep gradients between intake and powerhouse creating the necessary head. Hydropower facilities require a diversion dam to direct water from a stream into the hydraulic system that conveys the water to a powerhouse. Turbines and generators convert potential energy into electricity before the water returns to the stream. To locate hydropower opportunities, reliable elevation data, information

  • n land-use and land-cover as well as

precipitation data is required. Remote sensing data products can be used to derive a Digital Elevation Model (DEM) of the study area and to classify vegetation structures. Information about precipitation may be obtained from global climate databases, if local precipitation data is not available. Local discharge measurements and high accurate elevation data will increase the accuracy

  • f the outputs.

Several data products with difgerent accuracy levels can be used when applying the hydroMinds model. Even minimum standard data provide a good overview and allow comparing river sections as of their estimated hydropower potential. More accurate data products along with local data and expertise may lead to fjrst capacity appraisals of identifjed sites.

2 Methodology

Data Pre-Processing As all input data of the hydropower potential analysis is referring to spatial information, a Geographic Information System (GIS) will be established. For all calculations and data storage, a point grid layer of the study area is developed referring to the spatial resolution of the raster-based Digital Elevation Model. (DEM). Tie grid points represent cells with a square shape with the grid point being located in the center of the cell. All relevant spatial information is joined to the grid points according to its spatial

  • location. Tie attribute data of all grid

points is transferred to a sql-database serving the computer-based analysis and decision-making tool to estimate the technically and economically viable hydropower potential.

Jan-Philipp Grett and Torsten Fay

Small Hydropower Potential Assessment using Remote Sensing and Hydrological Data – The hydroMinds Model. Technical Report and Model Presentation.

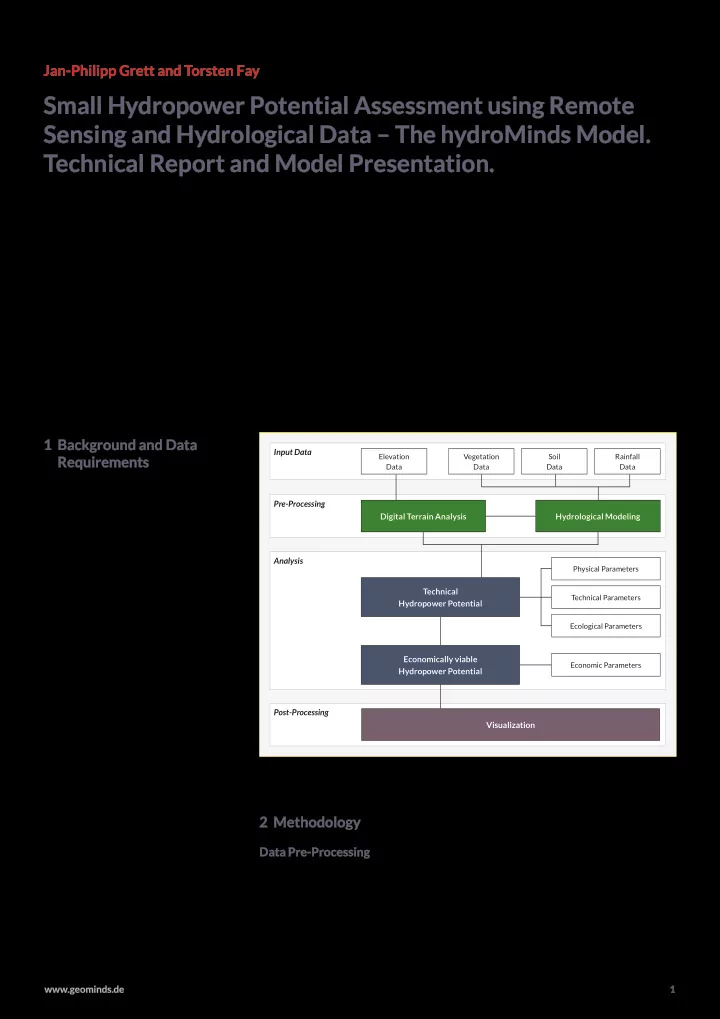
Elevation Data Vegetation Data Soil Data Rainfall Data

Digital Terrain Analysis

Economic Parameters

Technical Hydropower Potential Economically viable Hydropower Potential

Physical Parameters Technical Parameters Ecological Parameters

Hydrological Modeling Visualization Input Data Pre-Processing Analysis Post-Processing

Identifjcation of new renewable energy resources is of crucial importance to reduce fossil fuel dependency and to address the cause of climate change. In many countries, and particularly developing countries, insuffjcient information on stream networks and topography as well as a lack of expertise and project funding are often burdens for the implementation of new hydropower projects. To identify hydroelectric power opportunities even in remote areas, the hydroMinds model uses globally available remote sensing data. Stream networks and catchment areas are derived from a digital elevation model (DEM). Hydrological modeling and a GIS-based terrain analysis allow an estimation of the theoretical hydroelectric power potential of individual water courses, regions and whole

  • countries. Regional data and local expertise is not obligatory to produce results, but will help to validate or improve

the accuracy of the results. The web-based and stand-alone hydroMinds Tool allows modifying several parameters to prove and analyze impacts at identifjed sites without having to use additional software. Both, map outputs and the software tool allow estimating the hydropower potential for water courses even with few local data records, and help concentrating cost- and time-intensive in-depth studies to pre-identifjed sites.

  • Fig. 1: Flow Chart of the main components and processes of the hydroMinds model.

1 www.geominds.de

slide-2
SLIDE 2

Tie GIS-based analysis can be divided into the digital terrain analysis and the hydrological modeling. Digital Terrain Analysis Tie objective of the digital terrain analysis is to identify catchment boundaries and to model the topographic characteristics

  • f the catchment as well as the resulting

stream network. Tie GIS-based terrain analysis is subject to the presumption that the direct runofg of any given cell fmows downhill in the direction of the greatest slope. To allow all cells of the input DEM-data draining downhill, the elevation model is cleared of errors such as surface depressions, which would act as water sinks. To calculate the fmow direction for each grid point, the deterministic 8 (D8) algorithm is applied [4]. According to the fmow direction of all cells, each grid point is assigned a value corresponding to the number of cumulated cells fmowing to it [8]. Cells with no infmow correspond to the pattern of ridges and form catchment boundaries. To introduce a lower boundary for the calculation of the hydropower potential, a minimum hydraulic head and a minimum area to accumulate runofg water are defjned. Tie minimum size

  • f the hydrologic catchments is set to

4.5 km² which allows a sensible minimum fmow accumulation. Tie data processing routine recognizes only those grid points as river that are connected to at least the minimum catchment size. All river grid points of each catchment are joined to form the primary river of the respective catchment. All other grid points which are not defjned as rivers are assigned information about elevation, vegetation, soil and rainfall according to their spatial location and linked to the river data point they drain into. Tiis allows the calculation of the available discharge for every river grid point. Hydrological Modeling To minimize skew results of the hydrologic modeling process it is very important to apply only models that are suitable for the study region. Several hydrologic models have been developed and verifjed for the use in certain regional areas of the world. For all study areas with a good availability of essential input data, regionally verifjed hydrologic models can be applied. Tiis allows considering any kind of specifjc climatic condition of the study area that may have a strong impact

  • n the runofg processes, as for example

snow and ice occurrence during winter time in moderate climate zones. For all areas with limited data availability, a modifjed version of the US Soil Conservation Service Curve Number (SCS-CN) method for modeling the precipitation-runofg processes is applied to allow fjrst assumptions about the hydropower potential of the stream

  • network. Globally available satellite-

based data products can be obtained to compensate for any missing yet relevant input data. Tie original SCS-CN method is an empirical approach based on simplifjed, experimentally derived relationships. Tie combination of land-use, land-cover, hydrological soil type and the antecedent moisture condition of a grid cell are refmected in defjned curve number values [1], [11], [12]. According to the modifjed version, the direct runofg of each grid cell is calculated under consideration of variable runofg coeffjcients depending on the CN value and a 21-day prior rainfall-index as well as of regional climatic conditions [9], [13]. As steep slope conditions reduce the infjltration rate, a linear regression algorithm based on the slope inclination

  • f the grid cell complements the

hydrological modeling. Depending on the temporal resolution of the precipitation data, the available mean discharge at each river data point is calculated.

3 Estimating the Technical Hydropower Potential

Tie potential energy of downhill fmowing water of a stream regardless of any physical, technical or economic limitation is defjned as the gross theoretical hydropower

  • potential. According to physical and

technical reasons hydropower plants aren’t able to fully use the gross theoretical hydropower potential. Tie technical potential of hydropower describes the energy capacity that is actually useable when technical, infrastructural, ecological and other conditions are taken into consideration [3]. Applying the hydroMinds model, the technical hydropower potential is calculated for each grid point representing a river. Tius, each assessed river point forms a virtual powerhouse location. Tie virtual intake for the respective virtual project is defjned being 1,000 m upstream. Tiis assumption creates a series of virtual hydropower projects along the considered river to ensure compatibility.

  • Fig. 2: Streamfmow Discharge

Analysis of the Roseau

  • River. Final product of the

Hydropower Potential Analysis Dominica in 2013 applying the hydroMinds model. 2 www.geominds.de

slide-3
SLIDE 3

Tie technical hydropower potential for every possible virtual project combination is calculated according to the following equation: Tie following technical, physical and ecological infmuences reducing the gross theoretical hydropower potential are:

  • Any friction losses, that occur from

water fmowing through hydraulic conduits such as the intake, the trash- rack, canals and penstock including valves and other installations, are taken into account by reducing the actual available gross head relative to the fmow in the conduits. Tius, the net head is the geodetic elevation difgerence between virtual intake and virtual powerhouse (hgeo) minus hydraulic losses (hloss) resulting from friction in the water

  • conduit. It is assumed that friction

losses are proportional to the penstock length and defjned as 0.5 m loss of height per 100 m penstock length.

  • Tie predicted discharge amount used

for hydropower calculations is expected to be available statistically at 30% of days per year. To estimate the discharge with an exceedance probability of 30%, a fmow duration curve is synthetically generated for every analyzed stream.

  • Tie amount of discharge usable

for hydropower in an ecologically sustainable way is set to 75% of the available discharge at any point of time, while 25% of the water remains in the rivers as ecological fmow (Qeco) preserving the local aquatic ecosystem.

  • Tie plant effjciency summarizes all

energy conversion losses occurring in the process of electricity generation using turbines, generators and related equipment and is set to be η = 0.80.

  • Tie density of water is assumed to be

ρ = 1,000 kg/m³.

  • Tie strength of the gravitational fjeld is

depending on the location and mainly afgected by the parameters latitude, altitude, topography and geology and varies between g = 9.77 and 9.83 m/s².

4 Estimating the Economically Viable Hydropower Potential

With extending the penstock of a virtual project a higher elevation difgerence may be utilized resulting in a higher hydroelectric production capacity, but also increasing investment costs. Tius, a fjlter routine has been implemented, taking into account economic parameters such as investment costs of a virtual hydropower generation plant, average annual power production, project lifetime expectancy as well as the feed-in tarifg for selling electricity, calculating the net value of the virtual project. Tie virtual projects that have a negative net value are excluded from further analysis. Tie Internal Rate of Return (IRR)- method is applied to identify the top economically viable hydropower projects. As all economically related parameters are very sensitive and may lead to skew results of the analysis, the parameters and assumptions need to be modifjed and determined carefully according to local pricing conditions. For every analysis, government agencies, local experts, manufactures and suppliers are consulted to provide input data. Based

  • n the received information mean values

for the calculations of the computer based decision-making tool can be calculated. For every virtual project combination the net value is calculated. Calculation method and default values of assumptions are based on a study on small tropical islands in the Caribbean. Project Lifetime Tie project lifetime is assumed to be 25 years of operation. Annual Profjt Tie annual profjt is calculated by subtracting the annual operation and maintenance costs (O&M) from the annual revenue resulting from electricity sales relative to the design capacity of the project, capacity factor and the feed-in

  • tarifg. Tie calculation factors are estimated

as follows:

  • Installed Capacity

Tie installed capacity is the capacity corresponding to a discharge with an exceedance probability of 30% minus ecological minimum fmow, the head and the overall plant effjciency as used to estimate the technical hydropower potential.

  • Capacity Factor

Tie capacity factor is the ratio of the annual hours the virtual hydropower plant is operated at full design capacity in relation to the plant operating at full capacity full time (8,760 hours per year). Tie capacity factor as used in this analysis is defjned as 0.5.

  • Feed-in Tarifg

Tie feed-in tarifg is the amount of money per unit that a generator of electricity is remunerated for feeding-in electricity to the public grid. Tie feed-in tarifg is ofuen used as a policy mechanism designed to promote renewable energies. Feed-in tarifgs of US$ 0.10 to US$ 0.20 per kWh are considered. However, in many countries there is no fjxed feed-in tarifg yet.

  • Operation and Maintenance Costs

O&M costs are defjned as a percentage of the investment cost of each individual virtual project. Tiis includes the repair of mechanical and electrical equipment like turbine

  • verhaul, reinvestments in auxiliary

equipment such as communication and control systems. However, it does not cover the replacement of major electro-mechanical equipment

  • r

refurbishment of penstocks, tailraces,

  • etc. Tie O&M costs are assumed to be

5% of the total investment costs. Total Project Development Costs Tie total project development costs are calculated by adding general base costs of a virtual project to the costs for electro- mechanical equipment and the costs for the penstock. Tie calculation factors are estimated as follows:

  • Base Costs of Virtual Project

Tie base costs are assumed to be a fjxed amount of US$ 30,000 for every virtual

  • project. Tiese costs cover preliminary

studies, designs and all costs that occur in any event when developing a project.

NET VALUE = (Project Lifetime • Annual Profjt) – Total Project Development Costs ANNUAL PROFIT = (Installed Capacity • Capacity Factor • Feed-in Tariff) – O&M Costs PROJECT DEVELOPMENT COSTS = Base Costs of Virtual Project + Costs for electro-mechanical Equipment + Costs for Penstock

P = (hgeo– hloss ) • (Q – Qeco ) • g • ρ • η

hgeo = geodetic head between virtual intake and virtual powerhouse [m] hloss = friction loss from penstock [m] Q = long-term mean stream fmow at virtual intake [m³/s] Qeco = minimum amount of water remaining in the river for ecological reasons [m³/s] g = gravity [9.78 m/s²; constant] ρ = density of water [1,000kg/m³; constant] η = plant effjciency [%]

3 www.geominds.de

slide-4
SLIDE 4
  • Costs for electro-mechanical

Equipment Tie costs for the entire electro- mechanical equipment, site access infrastructure, grid connection and the construction

  • f

the powerhouse (excluding costs for the penstock) correlates with the installed design capacity

  • f

the hydropower plant and is assumed as US$ 3,333 per installed kW.

  • Costs for Penstock

Tie costs of the penstock are dependent

  • n its length, the material used and its
  • diameter. In addition to the material

costs there are costs for construction, site preparation as well as shipment and transportation costs. Corresponding to the design discharge, which is estimated for each river point, difgerent diameters of the penstock are selected based on the rule of limiting the fmow velocity in the penstock to 1.5 to 2.5 m/s. It is assumed that the penstock follows the course of the river. Tierefore, bends and special penstock elements are required for curves exceeding a certain

  • radius. Tiese extra costs are refmected in

10% higher penstock material costs. It is assumed that all penstocks are made of glass fjber reinforced polymer (GFRP). Tie penstock construction costs are based

  • n local wage levels according to skill

level and working time of personnel as well as foundation material costs according to local prices for concrete and steel. Each penstock segment is assumed to be installed over ground

  • n reinforced concrete foundations. Its

volume varies according to the diameter

  • f the penstock.

According to the penstock diameters, a difgerent amount of segments fjt into a 20‘ container. Tie cost for shipping of a container varies from regional and international destination zones. For all virtual projects with a positive net value the Internal Rate of Return (IRR) is calculated to determine the interest rate that is equivalent to the returns expected from the project. Tie IRR is computed using an iterative calculation process, using difgerent discount rates to get the discount rate that refers to a Net Present Value (NPV) = 0. Tie NPV of a virtual project is equal to the present value of future returns, discounted at the marginal cost of capital, minus the present value of the cost of the investment. It is assumed that every single virtual project will be developed and built in four years. In the fjrst year expenses for the feasibility study, project design and management are incurred which is assumed to be 1/60 of the total project development costs. Costs for civil works and all electro-mechanical equipment are spread almost evenly over the remaining three years. At the end of the fourth year the whole development is fjnished and all funds disbursed. Full operation time of every project is assumed to be 25 years. Tie computer-based decision-making tool identifjes the virtual project with the highest IRR of all possible virtual project

  • combinations. Tiis river section is blocked

from further screening in order to avoid double selection of the same section when selecting further virtual projects from the remaining river sections according to the next highest IRR value.

5 Results and Post-Processing

Tie data outputs of the hydroMinds model can be used to produce topographic and thematic maps of the study area using Geographic Information Systems (GIS). Additional diagrams, charts as well as 3D-views and other types of geographic visualization provide a good realistic overview of the study area and the identifjed locations. Tie rivers and individual river sections are classifjed according to their suitability for hydropower, identifying and pointing out the sites with the highest potential. For a more detailed micro-level assessment of identifjed locations, the hydroMinds tool, a stand-alone and web-based sofuware, allows modifying all parameters to analyze their impacts

  • n-site. No sophisticated sofuware or

high-performance computer systems are required for the post-processing as all calculations are webserver-based and results can be viewed, saved and printed using a web-browser. With local knowledge and the use of the hydroMinds tool, catchments may be examined individually with customized parameters to enhance the overall accuracy of the outputs.

NPV = = 0

R = Electrictiy Revenues O&M = Operation and Maintencance I = Investment Costs t

= Year of Operation

r = Discount Rate

∑ ( ) ( ) ∑ ( )

  • Fig. 3: Economically

viable hydropower potential of virtual projects of the Roseau

  • River. Final product
  • f the Hydropower

Potential Analysis Dominica in 2013 applying a feed-in tariff

  • f US$ 0.20).

4 www.geominds.de

slide-5
SLIDE 5

Even without local expertise, the tool allows data exploration to identify the sensitivity of the results to modifjcations

  • f parameters.

Conclusion

Hydroelectric power opportunities can be identifjed following the approach of the hydroMinds model using remote sensing and hydrological data. Tie results are preliminary however, but help concentrating required in-depth studies to pre-identifjed sites proving the economic viability of the planned hydropower project. Tie use of satellite data even allows investigating study areas where local data is not suffjcient. Although the accuracy

  • f the recommended remote sensing data

products can be considered to be good, local measurements may be required to validate the hydroMinds model. For hydrological modeling the widely- used SCS-CN method was modifjed according to the climate of tropical regions and was approved by local measurements, expertise and re-assessing the energy potential of existing hydropower plants in the Caribbean. To explore the data or to analyze identifjed locations in more detail, the hydroMinds Tool provides an indication

  • f the estimated range of hydropower

plant design capacities according to difgerent input parameters. Both, the hydroMinds model and sofuware-tool can improve the implementation process

  • f new hydropower projects and help

establishing a sustainable and climate- friendly energy use. Authors Jan-Philipp Grett, M.Sc. Torsten Fay, B.Sc.

geoMinds - Geo-Solutions and Consulting Ippendorfer Allee 94 53127 Bonn info@geominds.de www.geominds.de

Sources

[1] COX, C. (2003): Integrated Watershed Management Planning for St. Lucia. Montreal, Canada. [2] GESELLSCHAFT FÜR TECHNISCHE ZUSAMMEN- ARBEIT (GTZ) (2007): Energiepolitische Rahmenbedingungen für Strommärkte und erneuerbare Energien. 23 Länderanalysen Kapitel Karibik, Eschborn, Germany. [3] HORLACHER, B. (2003): Globale Potenziale der

  • Wasserkrafu. Externe Expertise für das

Hauptgutachten des Wissenschafulichen Beirats der Bundesregierung Globale Umweltveränderungen (WBGU) 2003: Welt im Wandel: Energiewende zur

  • Nachhaltigkeit. Berlin.

[4] JENSON, S. and J. DOMINGUE (1988): Extracting Topographic Structure from Digital Elevation Data for Geographic System Analysis. In: Photogrammetric Engineering and Remote Sensing, Vol. 54, No. 11; p. 1593-1600. [5] INTERNATIONAL ENERGY AGENCY (IEA) (2011): Renewable Energy. Markets and Prospects by Technology, OECD/ IEA, Paris. [6] INTERNATIONAL RENEWABLE ENERGY AGENCY (IRENA) (2012): Hydropower. Renewable Energy Technologies: Cost Analysis Series. Vol 1: Power Sector Issue 3/5. [7] INTERGOVERNMENTAL PANEL ON CLIMATE CHANGE (IPCC) (2011): Renewable Energy Sources and Climate Change Mitigation. Special Report of the Intergovernmental Panel on Climate Change. New York. [8] O’CALLAGHAN J. AND D. MARK (1984): Tie Extraction of Drainage Networks from Digital Elevation Data. In: Computer Vision, Graphics and Image Processing. Vol. 28, S. 323-344. [9] SARTOR, J. (1999): Einsatz der Langzeit-Serien- simulation für kleine Einzugsgebiete. In: Reports of the Hydraulic Engineering and Water Management Unit, Department of Civil Engineering, University of Kaiserslautern, Vol. 9. [10] TACHIKAWA, T. ET AL. (2011): ASTER Global Digital Elevation Model Version 2 – Summary of Validation Results. August 31, 2011. [11] UNITED STATES DEPARTMENT OF AGRICULTURE / NATURAL RESOURCES CONSERVATION SERVICE (USDA/NRCS) (1986): Urban Hydrology for Small Watersheds.Technical Release 55. Washington. [12] USDA NATURAL RESOURCES CONSERVATION SERVICE (NRCS) (2004): National Engineering

  • Handbook. Part 630, Hydrology. Washington.

[13] ZAISS, H. (1989): Simulation ereignisspezifjscher Einfmüsse des Niederschlag-Abfmuss-Prozesses von Hochwasser-ereignissen kleiner Einzugsgebiete mit N-A-Modellen. In: Technischer Bericht des Instituts für Ingenieurhydrologie und Hydraulik, TU Darmstadt, Vol. 42.

5 www.geominds.de