SIMULATION OF SO 2 EPISODES EXCEEDING EU REGULATIONS IN THE - - PowerPoint PPT Presentation

simulation of so 2 episodes exceeding eu regulations in
SMART_READER_LITE
LIVE PREVIEW

SIMULATION OF SO 2 EPISODES EXCEEDING EU REGULATIONS IN THE - - PowerPoint PPT Presentation

C A I R N Dveloppement SIMULATION OF SO 2 EPISODES EXCEEDING EU REGULATIONS IN THE INDUSTRIAL AREA OF LE HAVRE WITH THE MM5, SWIFT AND SPRAY MODELS Sylvie Perdriel sperdriel@cairn-dev.fr, Jacques Moussafir jmoussafir@aria.fr,


slide-1
SLIDE 1

C A I R N Développement

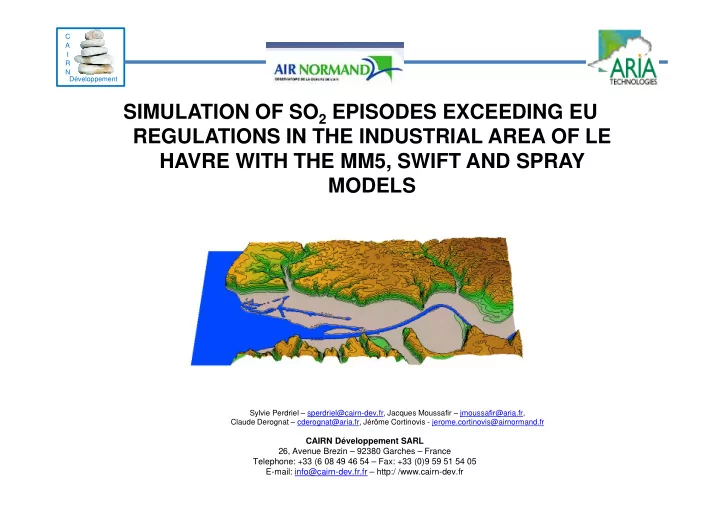
SIMULATION OF SO2 EPISODES EXCEEDING EU REGULATIONS IN THE INDUSTRIAL AREA OF LE HAVRE WITH THE MM5, SWIFT AND SPRAY MODELS

CAIRN Développement SARL 26, Avenue Brezin – 92380 Garches – France Telephone: +33 (6 08 49 46 54 – Fax: +33 (0)9 59 51 54 05 E-mail: info@cairn-dev.fr.fr – http:/ /www.cairn-dev.fr

Sylvie Perdriel – sperdriel@cairn-dev.fr, Jacques Moussafir – jmoussafir@aria.fr, Claude Derognat – cderognat@aria.fr, Jérôme Cortinovis - jerome.cortinovis@airnormand.fr

slide-2
SLIDE 2

C A I R N Développement

Summary

Context and Goal Input Data

Topography Meteorological data Emission data

Modelisation scheme Modelisation scheme Model validation Validation of the emission mitigation measures Conclusion

slide-3
SLIDE 3

C A I R N Développement

SO2 Peaks Study – Le Havre area Context and Goal 1/2 European regulations for SO2:

Daily concentration averages:

  • Cm < 125 µg/m3
  • Maximum number of exceedance / year : 3

Hourly concentration averages:

  • Ch < 350 µg/m3

3

  • Ch < 350 µg/m
  • Maximum number of exceedance / year : 24

2007 measurements: Number of exceedance per

industrial zone

Industrial Zone Cm Ch Le Havre 18 37 Port Jérôme 5 18

slide-4
SLIDE 4

C A I R N Développement

SO2 Peaks Study – Le Havre area Context and Goal 2/2

European commission ask French Government to respect the european regulations The local industry manager DREAL had to validate emission mitigation measures asked to the industrial plants plants Choice of air dispersion modeling has been made for this validation in a two step study :

The model validation over the 2007 peak episodes for 5 sensors The modeling of the mitigation reductions over these episodes and comparisons with the EU regulations

slide-5
SLIDE 5

C A I R N Développement

SO2 Peaks Study – Le Havre area

Site description

Sea shore site: WideEstuary extended by the Seine river High cliff : 100 m along the northern border of the estuary

5

Données topographiques : IGN – 100m )

Land Cover map Purple Industrial zones Red towns

slide-6
SLIDE 6

C A I R N Développement

SO2 Peaks Study – Le Havre area

Concentration sensors

EDF power plant TOTAL petrochemical plant EXXON petrochemical plant

slide-7
SLIDE 7

C A I R N Développement

SO2 Peaks Study – Le Havre area Meteorological data

TDF : WS, WD 40m, T Octeville WS, WD 10m CAU : WS, WD at 119m, T profile : 3119m TDF : WS, WD 40m, T profile : 6-40 m RNO : WS, WD 10m PJZ: WS, WD 10m Cap de la Hève WS, WD 10m

slide-8
SLIDE 8

C A I R N Développement

SO2 Peaks Study – Le Havre area

Stacks

Plant :

EDF : 3 stacks– H: 240m each TOTAL : 18 stacks – H: 25 to 110m EXXON MOBIL : 16 stacks – H: 38 to 140m takes into account 90% of SO2 releases for Le Havre area and 95% for Port Jérôme area and 95% for Port Jérôme area

SO2 emission rates Given by the Industrials

  • n an hourly basis
slide-9
SLIDE 9

C A I R N Développement

SO2 Peaks Study – Le Havre area

Wind Modeling

Two different approaches

Using only local meteorological data : SWIFT model using all local meteorological stations : 100m resolution A classical nested approach from continental scale to regionalm scale MM5+ SWIFT scale MM5+ SWIFT

  • MM5 :

3D pour prévision ou analyse à échelle régionale Imbrication de plusieurs domaines résolution finale 3km Initialisation à partir des données NCEP (ex GFS)

  • Adaptation à l’échelle du site : SWIFT

Assimilation des verticales mMM5 à des mesures virtuelles Assimilations de toutes les mesures du site Utilisation des données du site à petite échelle

slide-10
SLIDE 10

C A I R N Développement

MM5 – D2

SO2 Peaks Study – Le Havre area

Wind Modeling : nesting approach

Domain Resolution MM5 - D1 27 Km MM5 - D2 9 Km MM5 - D3 3 Km

MM5- D1 MM5 – D3

MM5 - D3 3 Km SWIFT 1 400 m SWIFT 2 100m

SWIFT 1

Virtual wind and temperature profils

Local data SWIFT 2

slide-11
SLIDE 11

C A I R N Développement

SO2 Peaks Study – Le Havre area Local scale domains

To improve simulation time 3 simulation domains have been considered

Le Havre domain

Domain SW point Number

  • f points

Size in Km Le Havre (433,2495) 201x141 20.1x14.1 Port Jérome (461,2497) 151x121 15.1x12.1 Le Havre+Port Jérôme (432,2495) 451x151 45.1x15.1

23/07/2010 11 11 Port Jérôme domain All domains together

slide-12
SLIDE 12

C A I R N Développement

SO2 Peaks Study – Le Havre area Dispersion Modeling :Spray

Non steady state lagrangian dispersion model Wind and turbulence fields coming for SWIFT Well adapted to complex topography High number of particle release accuracy :1µg/m3

slide-13
SLIDE 13

C A I R N Développement

SO2 Peaks Study – Le Havre area Model Validation

Choice of the validation point

Wind speed sensor precision : +/-0.5 m/s

At 2km, possible delay of 15mn on the plume transport

Wind direction sensor precision : +/-5 °

At 2km, possible error of 180m for the plume center line We choose to take the Best 4 calculated values at t-dt t, t+dt with dt=1/4h

Sensor

slide-14
SLIDE 14

C A I R N Développement

SO2 Peaks Study – Le Havre area Model Validation Results

Caractéristiques des pointes :

58 simulations : 14 dealing with hourly concentration averages 36 dealing with dailyconcentration averages 8 dealing with both hourly and daily concentration averages concentration averages

  • Results:

32 good simulations : ex : Port Jérôme , Le Havre 26 not so good simulations : ex : Port Jérôme , Le Havre

slide-15
SLIDE 15

C A I R N Développement

SO2 Peaks Study – Le Havre area Simulation n° 1 – Port Jérôme

Well correlated wind speeds and directions Meteorological data Good results ! ND2

slide-16
SLIDE 16

C A I R N Développement

SO2 Peaks Study – Le Havre area Simulation n° 24 – Port Jérôme

Low and uncorrelated winds– Fluctuant wind directions Meteorological data ND2 Sensor Poor results ! ND2 Sensor

slide-17
SLIDE 17

C A I R N Développement

SO2 Peaks Study – Le Havre area Simulation n° 24 – Le Havre

Well correlated wind speeds and directions Meteorological data Good results ! ROM Sensor

slide-18
SLIDE 18

C A I R N Développement

SO2 Peaks Study – Le Havre area Simulation n° 11 – Le Havre

ROM Sensor GOR Sensor Meteorological data ROM Sensor GOR Sensor

slide-19
SLIDE 19

C A I R N Développement

SO2 Peaks Study – Le Havre area Statistical results

Port Jérôme : Good results

  • Le Havre: Ok for the GOR and ROG sensors – Not ok for CAU

Coefficient de corrélation ND2 sensor Correlation 0.56 Fractional Biais

  • 0.12

Mean geometric Biais 0.9 FAC2 0.91 Coefficient de corrélation GOR ROM CAU

  • Both sites at the same time : OK for moderate to high wind

speeds, not OK for low wind speeds most of the situations

corrélation Correlation 0.59 0.52 0.27 Fractional Biais 0.05 0.05

  • 1.11

Mean geometric Biais 1. 1. 0.5 FAC2 0.86 0.68 0.31 Coefficient de corrélation ND2 GOR ROM CAU Correlation

  • 0.24

0.34

  • 0.06

0.03 Fractional Biais

  • 0.71
  • 0.15
  • 0.68
  • 1.5

Mean geometric Biais 0.5 0.7 0.7 0.2 FAC2 70% 58% 48% 13%

slide-20
SLIDE 20

C A I R N Développement

SO2 Peaks Study – Le Havre area Model validation conclusion

Two categories of meteorological situations :

  • Moderate to high wind speeds with good correlation between

the ground stations and profiles good or acceptable results

  • Low and fluctuant winds poor results

An exceptional meteorological situation : christmas 2007 with a very stable situation, very low wind speeds during 4 days poor results during 4 days poor results Further work on models to improve this low wind situations :

Enhance turbulence scheme Try to use ECMWF results instead of GFS Have a real vertical profile in the estuary to measure vertical gradients at stack heights

slide-21
SLIDE 21

C A I R N Développement

SO2 Peaks Study – Le Havre area Validation of the mitigation measures

The well represented peaks have been kept to validate the mitigation measures A new sets of simulation have been performed taking into account emission mitigations In each case, results have been presented taking into account the modeling errors from the model validation account the modeling errors from the model validation

Simulation 1 – Daily concentration Simulation 1 – Hourly concentration averages

Only one situation still shows SO2 concentration exeeding EU regulations

slide-22
SLIDE 22

C A I R N Développement

SO2 Peaks Study – Le Havre area Validation of the mitigation measures

Thank You for your attention Thank You for your attention