
SLIDE 1
Simulating the 4% Universe Hydro-cosmology simulations and data - - PowerPoint PPT Presentation
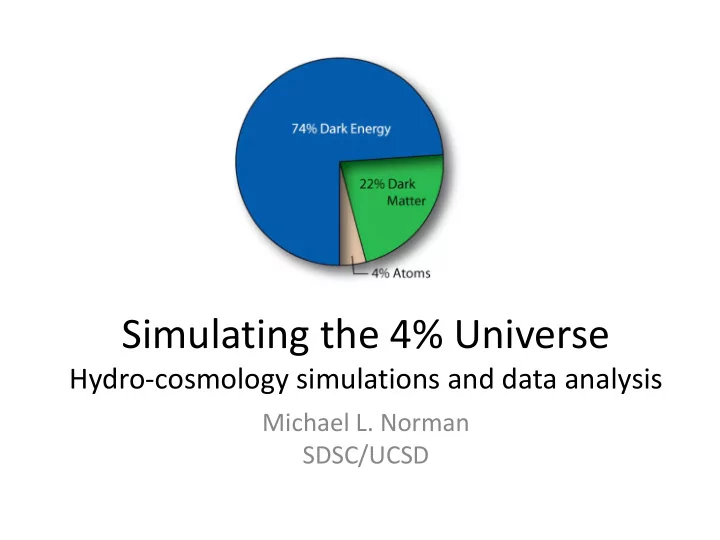
Simulating the 4% Universe Hydro-cosmology simulations and data analysis Michael L. Norman SDSC/UCSD Lecture Plan Lecture 1: Hydro-cosmology simulations of baryons in the Cosmic Web Lyman alpha forest (LAF) Baryon Acoustic
7/17/2012 ISSAC 2012, SDSC, San Diego USA 2
7/17/2012 ISSAC 2012, SDSC, San Diego USA 3
Cosmic Renaissance
7/17/2012 ISSAC 2012, SDSC, San Diego USA 4
7/17/2012 ISSAC 2012, SDSC, San Diego USA 5
7/17/2012 ISSAC 2012, SDSC, San Diego USA 6
– (small boxes < 10 Mpc) – CRHD+SF+ionization+heating – e.g., Gnedin 2000, Razoumov et al. 2002
– (large boxes > 100 Mpc) – N-body + RT – e.g., Iliev et al. 2006
– (large boxes > 100 Mpc) – CRHD+SF+ionization+heating – Norman et al. 2012, in prep.
7/17/2012 ISSAC 2012, SDSC, San Diego USA 7
7/17/2012 ISSAC 2012, SDSC, San Diego USA 8
7/17/2012 ISSAC 2012, SDSC, San Diego USA 9
7/17/2012 ISSAC 2012, SDSC, San Diego USA 10
7/17/2012 ISSAC 2012, SDSC, San Diego USA 11
7/17/2012 ISSAC 2012, SDSC, San Diego USA 12
32003 cells/particles
8003 cells/particles
Run A and Run B have identical mass and spatial resolution, physics, ICs, etc.
7/17/2012 ISSAC 2012, SDSC, San Diego USA 13
7/17/2012 ISSAC 2012, SDSC, San Diego USA 14
http://enzo.googlecode.com
– 6 species fluid dynamics: PPM – Dark matter dynamics: Particle-Mesh – Gravity: FFTs
limited diffusion, coupled to gas ionization and energy equation (Reynolds et al. 2009)
modified Cen & Ostriker 92 with “distributed feedback” (Smith et al. 2011)
– Calibrated to Bouwens et al. (2011) SFRD
from Ricotti, Gnedin & Shull 2002
7/17/2012 ISSAC 2012, SDSC, San Diego USA 15
Shapiro & Giroux ‘87 analytic test problem
7/17/2012 ISSAC 2012, SDSC, San Diego USA 16
7/17/2012 ISSAC 2012, SDSC, San Diego USA 17
z=12.5 z=9.2 z=8 z=7 z=6 t=362 Myr t=552 Myr t=664 Myr t=792 Myr t=969 Myr
Redshift/time evolution of density and temperature 8003/20 Mpc/512 core
density temperature
7/17/2012 ISSAC 2012, SDSC, San Diego USA 18
Redshift/time evolution of density and temperature 8003/20 Mpc/512 core
density temperature
7/17/2012 ISSAC 2012, SDSC, San Diego USA 19
7/17/2012 ISSAC 2012, SDSC, San Diego USA 20
7/17/2012 ISSAC 2012, SDSC, San Diego USA 21
ionizing photons per H atom
7/17/2012 ISSAC 2012, SDSC, San Diego USA 22
– Loop over all redshift
fHII>0.9 – Uses nested parallel
work on 256 cores – 56 sec on Gordon including IO
Z-reion
7/17/2012 ISSAC 2012, SDSC, San Diego USA 23
7/17/2012 ISSAC 2012, SDSC, San Diego USA 24
7/17/2012 ISSAC 2012, SDSC, San Diego USA 25
slice
7/17/2012 ISSAC 2012, SDSC, San Diego USA 26
slice
7/17/2012 ISSAC 2012, SDSC, San Diego USA 28
7/17/2012 ISSAC 2012, SDSC, San Diego USA 29
Z=7 Z=6.5 Z=6.05 80 cMpc Projected HI fraction Large-scale neutral patches before overlap
7/17/2012 ISSAC 2012, SDSC, San Diego USA 30
7/17/2012 ISSAC 2012, SDSC, San Diego USA 31
Z=7.3
7/17/2012 ISSAC 2012, SDSC, San Diego USA 32
Star formation strongly suppressed at Mh < 5x10⁹ Ms
7/17/2012 ISSAC 2012, SDSC, San Diego USA 33
adiabatic hydro SF + SN feedback SF + SN feedback + radiative feedback
7/17/2012 ISSAC 2012, SDSC, San Diego USA 34
Ratio of Halo Gas Masses Depletion of baryons due to SN feedback Depletion of baryons due to radiative feedback
7/17/2012 ISSAC 2012, SDSC, San Diego USA 35
Density fields from RHD and non-RHD models
z=8, RHD z=8, HD Visualization by J. Insley (ANL) & R. Wagner (SDSC) Z=8
7/17/2012 ISSAC 2012, SDSC, San Diego USA 36
Normailzed density difference between RHD and non-RHD models
z=8, RHD z=8, HD Visualization by J. Insley (ANL) & R. Wagner (SDSC) Z=8
7/17/2012 ISSAC 2012, SDSC, San Diego USA 37
Normailzed density difference between RHD and non-RHD models
z=8, RHD z=8, HD Visualization by J. Insley (ANL) & R. Wagner (SDSC) Z=8 non-radiative radiative no difference
7/17/2012 ISSAC 2012, SDSC, San Diego USA 38
radiative density dist. non-radiative density dist. normalized density difference
yellow
7/17/2012 ISSAC 2012, SDSC, San Diego USA 39
7/17/2012 ISSAC 2012, SDSC, San Diego USA 40
7/17/2012 ISSAC 2012, SDSC, San Diego USA 41
7/17/2012 ISSAC 2012, SDSC, San Diego USA 42
7/17/2012 ISSAC 2012, SDSC, San Diego USA 43
SAN DIEGO SUPERCOMPUTER CENTER at the UNIVERSITY OF CALIFORNIA; SAN DIEGO
Source: Rick Wagner, Michael L. Norman. SDC. Used by permission. 2012
We have run two large (32003 uniform grid) simulations, with and without radiation hydrodynamics, to measure the effect of the light from the first stars on the evolution of the universe. To quantitatively compare the matter distribution of each simulation, we use radially binned 3D power spectra.
Individual simulations Power spectra
threaded code
Difference
7/17/2012 ISSAC 2012, SDSC, San Diego USA 45