
1
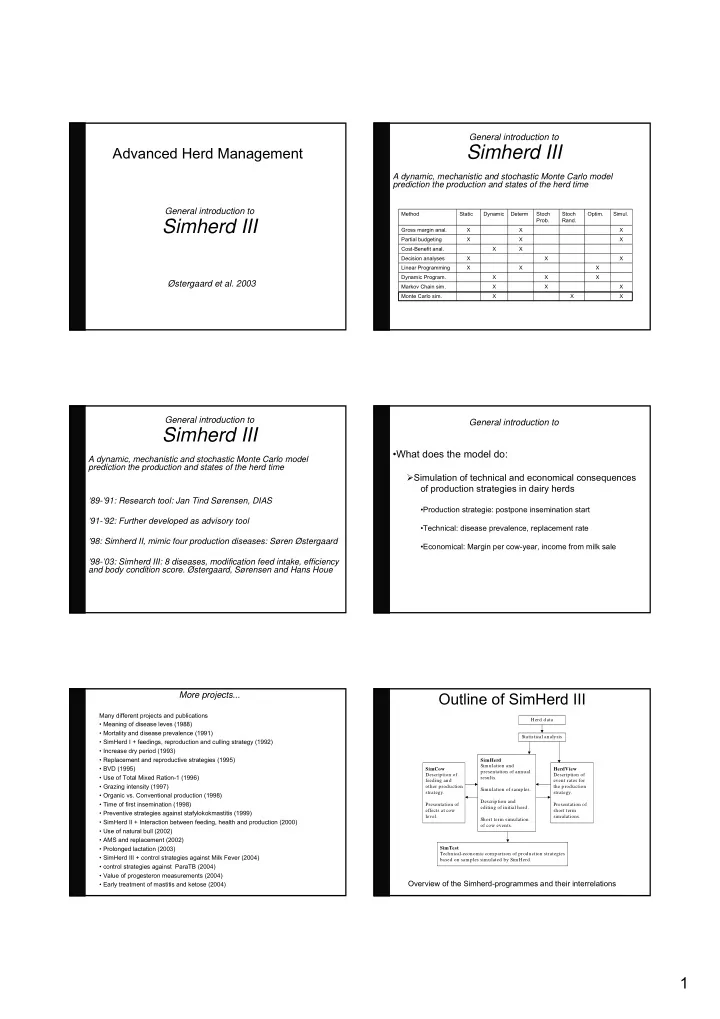
General introduction to
Simherd III
Advanced Herd Management
Østergaard et al. 2003 General introduction to
Simherd III
A dynamic, mechanistic and stochastic Monte Carlo model prediction the production and states of the herd time
X X X Monte Carlo sim. X X X Markov Chain sim. X X X Dynamic Program. X X X Linear Programming X X X Decision analyses X X Cost-Benefit anal. X X X Partial budgeting X X X Gross margin anal. Simul. Optim. Stoch Rand. Stoch Prob. Determ Dynamic Static Method
General introduction to
Simherd III
’89-’91: Research tool: Jan Tind Sørensen, DIAS ’91-’92: Further developed as advisory tool ’98: Simherd II, mimic four production diseases: Søren Østergaard ’98-’03: Simherd III: 8 diseases, modification feed intake, efficiency and body condition score. Østergaard, Sørensen and Hans Houe A dynamic, mechanistic and stochastic Monte Carlo model prediction the production and states of the herd time General introduction to
- What does the model do:
Simulation of technical and economical consequences
- f production strategies in dairy herds
- Production strategie: postpone insemination start
- Technical: disease prevalence, replacement rate
- Economical: Margin per cow-year, income from milk sale
More projects...
Many different projects and publications
- Meaning of disease leves (1988)
- Mortality and disease prevalence (1991)
- SimHerd I + feedings, reproduction and culling strategy (1992)
- Increase dry period (1993)
- Replacement and reproductive strategies (1995)
- BVD (1995)
- Use of Total Mixed Ration-1 (1996)
- Grazing intensity (1997)
- Organic vs. Conventional production (1998)
- Time of first insemination (1998)
- Preventive strategies against stafylokokmastitis (1999)
- SimHerd II + Interaction between feeding, health and production (2000)
- Use of natural bull (2002)
- AMS and replacement (2002)
- Prolonged lactation (2003)
- SimHerd III + control strategies against Milk Fever (2004)
- control strategies against ParaTB (2004)
- Value of progesteron measurements (2004)
- Early treatment of mastitis and ketose (2004)
Outline of SimHerd III
Statistical analysis HerdView Description of event rates for the production strategy. Presentation of short term simulations. SimHerd Simulation and presentation of annual results. Simulation of samples. Description and editing of initial herd. Short term simulation
- f cow events.
SimCow Description of feeding and
- ther production
strategy. Presentation of effects at cow level. SimTest Technical-economic comparison of production strategies based on samples simulated by SimHerd. Herd data
Overview of the Simherd-programmes and their interrelations