
SLIDE 1
Bogdan Blidaru Particle tracking and identification at high rates WS 16/17 Page 1
(Signal creation, energy loss, PID) Particle tracking and - - PowerPoint PPT Presentation
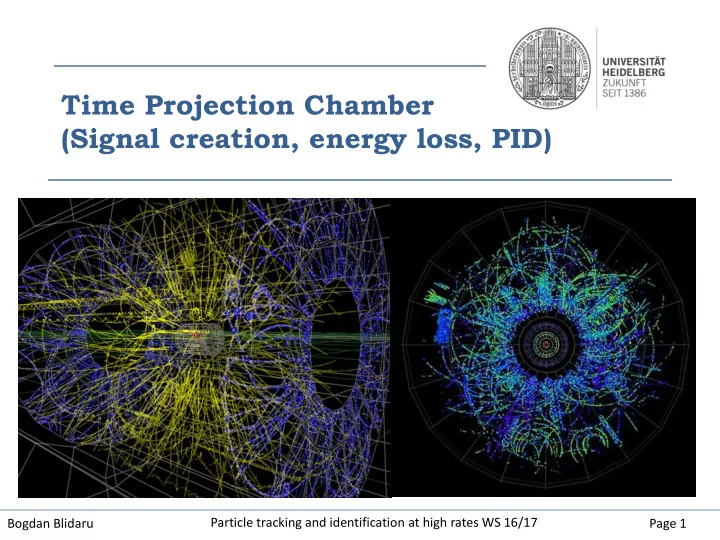
Time Projection Chamber (Signal creation, energy loss, PID) Particle tracking and identification at high rates WS 16/17 Bogdan Blidaru Page 1 Motivation Standard detector courses describe to some extent how the signal is created and how
Bogdan Blidaru Particle tracking and identification at high rates WS 16/17 Page 1
Bogdan Blidaru Particle tracking and identification at high rates WS 16/17 Page 2
The Flammarion Engraving
Bogdan Blidaru Particle tracking and identification at high rates WS 16/17 Page 3
The Flammarion Engraving
Bogdan Blidaru Particle tracking and identification at high rates WS 16/17 Page 4
The Flammarion Engraving
Bogdan Blidaru Particle tracking and identification at high rates WS 16/17 Page 5
The Flammarion Engraving
Bogdan Blidaru Particle tracking and identification at high rates WS 16/17 Page 6
The Flammarion Engraving
Bogdan Blidaru Particle tracking and identification at high rates WS 16/17 Page 7
The Flammarion Engraving
Bogdan Blidaru Particle tracking and identification at high rates WS 16/17 Page 8
Bogdan Blidaru Particle tracking and identification at high rates WS 16/17 Page 9
Bogdan Blidaru Particle tracking and identification at high rates WS 16/17 Page 10
Bogdan Blidaru Particle tracking and identification at high rates WS 16/17 Page 11
Density dependent [S/ρ] [MeV/g/cm2]
Bogdan Blidaru Particle tracking and identification at high rates WS 16/17 Page 12
Bogdan Blidaru Particle tracking and identification at high rates WS 16/17 Page 13
More or less the same for different materials (except for the Hydrogen)
Bogdan Blidaru Particle tracking and identification at high rates WS 16/17 Page 14
More or less the same for different materials (except for the Hydrogen) Leads to a slow rise of ionization losses with the particle momentum (accounting for relativistic flattening of the electric field of the incoming particle)
Bogdan Blidaru Particle tracking and identification at high rates WS 16/17 Page 15
More or less the same for different materials (except for the Hydrogen) Leads to a slow rise of ionization losses with the particle momentum (accounting for relativistic flattening of the electric field of the incoming particle) Maximum energy transfer to an electron (limited by E-p conservation laws)
Bogdan Blidaru Particle tracking and identification at high rates WS 16/17 Page 16
More or less the same for different materials (except for the Hydrogen) Leads to a slow rise of ionization losses with the particle momentum (accounting for relativistic flattening of the electric field of the incoming particle) Maximum energy transfer to an electron (limited by E-p conservation laws) Density effect factor (polarization of the medium)
Bogdan Blidaru Particle tracking and identification at high rates WS 16/17 Page 17
Bogdan Blidaru Particle tracking and identification at high rates WS 16/17 Page 18
Bogdan Blidaru Particle tracking and identification at high rates WS 16/17 Page 19
Bogdan Blidaru Particle tracking and identification at high rates WS 16/17 Page 20
Bogdan Blidaru Particle tracking and identification at high rates WS 16/17 Page 21
Bogdan Blidaru Particle tracking and identification at high rates WS 16/17 Page 22
Bogdan Blidaru Particle tracking and identification at high rates WS 16/17 Page 23
(photon emission by an electron accelerated in Coulomb field of nucleus)
Bremsstrahlung – dominant process for E > 10-30 MeV Within ALICE ITS & TPC: low material budget (~10% of radiation length for normal incident particles)
Bogdan Blidaru Particle tracking and identification at high rates WS 16/17 Page 24
Low momenta
reduce the material budget as much as possible (RUN3 goal)
Bogdan Blidaru Particle tracking and identification at high rates WS 16/17 Page 25
Typical range of E for the operation of HEP TPC’s
Bogdan Blidaru Particle tracking and identification at high rates WS 16/17 Page 26
Region of minimum ionization approximately independent
Relativistic rise Fermi Plateau Energy loss basically depends
Bogdan Blidaru Particle tracking and identification at high rates WS 16/17 Page 27
True in the first approximation…
Bogdan Blidaru Particle tracking and identification at high rates WS 16/17 Page 28
Bogdan Blidaru Particle tracking and identification at high rates WS 16/17 Page 29
Bogdan Blidaru Particle tracking and identification at high rates WS 16/17 Page 30
Bogdan Blidaru Particle tracking and identification at high rates WS 16/17 Page 31
ALICE TPC (Ne:CO2)
Bogdan Blidaru Particle tracking and identification at high rates WS 16/17 Page 32
Bogdan Blidaru Particle tracking and identification at high rates WS 16/17 Page 33
per 1 ppm of O2. Signal attenuation ~ 2.5% for the full drift length
drift length mean free path
Leads to a decrease of signal
Bogdan Blidaru Particle tracking and identification at high rates WS 16/17 Page 34
per 1 ppm of O2. Signal attenuation ~ 2.5% for the full drift length
drift length mean free path
Leads to a decrease of signal Ex.: in ALICE TPC:
something contaminated the gas mixture
electron attachment
smaller signal
time the problem was reported
Bogdan Blidaru Particle tracking and identification at high rates WS 16/17 Page 35
Distribution of E transfer for Ar at γ=1000
Integral cluster size distribution in Ar
Q(n) – probability that the cluster has more than n electrons
Random process of primary e- creation smeared out function The continuous lines are hand-drawn interpolations whereas the broken lines are extrapolations corresponding to the 1/n2 law for large n
Bogdan Blidaru Particle tracking and identification at high rates WS 16/17 Page 36
Bogdan Blidaru Particle tracking and identification at high rates WS 16/17 Page 37
G and vD affected by p & T fluctuations
due to temperature modification ~400μm (compared to 200 μm of the resolution)
Bogdan Blidaru Particle tracking and identification at high rates WS 16/17 Page 38
Bogdan Blidaru Particle tracking and identification at high rates WS 16/17 Page 39
Bogdan Blidaru Particle tracking and identification at high rates WS 16/17 Page 40
geometry, temperature, pressure dependent
Envelope of ions around the wire influences the shape of the induced signal (next slides)
Bogdan Blidaru Particle tracking and identification at high rates WS 16/17 Page 41
geometry, temperature, pressure dependent
Envelope of ions around the wire influences the shape of the induced signal (next slides)
Bogdan Blidaru Particle tracking and identification at high rates WS 16/17 Page 42
In practical cases varies between 5 and 8
Bogdan Blidaru Particle tracking and identification at high rates WS 16/17 Page 43
Ionization mode: full charge collection no multiplication; gain ≈ 1 Proportional mode: multiplication of ionization signal proportional to ionization measurement of dE/dx secondary avalanches need quenching gain ≈ 104 – 105 ~ linear with voltage Limited proportional mode [streamer]: strong photoemission requires strong quenchers or pulsed HV gain ≈ 1010 Geiger mode: massive photoemission full length of the anode wire affected discharge stopped by HV cut
Bogdan Blidaru Particle tracking and identification at high rates WS 16/17 Page 44
Ionization mode: full charge collection no multiplication; gain ≈ 1 Proportional mode: multiplication of ionization signal proportional to ionization measurement of dE/dx secondary avalanches need quenching gain ≈ 104 – 105 ~ linear with voltage Limited proportional mode [streamer]: strong photoemission requires strong quenchers or pulsed HV gain ≈ 1010 Geiger mode: massive photoemission full length of the anode wire affected discharge stopped by HV cut
Bogdan Blidaru Particle tracking and identification at high rates WS 16/17 Page 45
Ionization mode: full charge collection no multiplication; gain ≈ 1 Proportional mode: multiplication of ionization signal proportional to ionization measurement of dE/dx secondary avalanches need quenching gain ≈ 104 – 105 ~ linear with voltage Limited proportional mode [streamer]: strong photoemission requires strong quenchers or pulsed HV gain ≈ 1010 Geiger mode: massive photoemission full length of the anode wire affected discharge stopped by HV cut
Bogdan Blidaru Particle tracking and identification at high rates WS 16/17 Page 46
Ionization mode: full charge collection no multiplication; gain ≈ 1 Proportional mode: multiplication of ionization signal proportional to ionization measurement of dE/dx secondary avalanches need quenching gain ≈ 104 – 105 ~ linear with voltage Limited proportional mode [streamer]: strong photoemission requires strong quenchers or pulsed HV gain ≈ 1010 Geiger mode: massive photoemission full length of the anode wire affected discharge stopped by HV cut
Bogdan Blidaru Particle tracking and identification at high rates WS 16/17 Page 47
In the regions where the TPC is operating the dependence of the amplitude to voltage is assumed to be exponential.
Bogdan Blidaru Particle tracking and identification at high rates WS 16/17 Page 48
Variations of the gas gain (0.8 - 1.2) within
and chamber geometry (deformations, wire sag) can reach up to about 20%.
In the regions where the TPC is operating the dependence of the amplitude to voltage is assumed to be exponential.
Bogdan Blidaru Particle tracking and identification at high rates WS 16/17 Page 49
Characteristic decay spectrum for each pad + fit of main peak (local gain higher spectrum wider)
Bogdan Blidaru Particle tracking and identification at high rates WS 16/17 Page 50
IROC: wire to pad distance is 2mm, width of the induction signal is 2mm. OROC: wire to pad distance is 3mm, width of the induction signal is 3mm.
Bogdan Blidaru Particle tracking and identification at high rates WS 16/17 Page 51
Signal almost entirely due to ions. Electrons reach the wire in ~0.2ns. Integration time of the signal ~200ns. The electrons cannot be detected. In drift tubes the signal can be calculated using:
Ions moving from the wire surface to the tube wall induce a current signal on the grounded wire
Bogdan Blidaru Particle tracking and identification at high rates WS 16/17 Page 52
Signal almost entirely due to ions. Electrons reach the wire in ~0.2ns. Integration time of the signal ~200ns. The electrons cannot be detected. In drift tubes the signal can be calculated using:
Ions moving from the wire surface to the tube wall induce a current signal on the grounded wire Time development of a current pulse described by Qind The extremely sharp onset can be observed as well as the extremely long tail characteristic of such pulses
Bogdan Blidaru Particle tracking and identification at high rates WS 16/17 Page 53
pad width pad height surface charge density
anode-cathode separation
IROC, OROC: wire to pad distance is 2, 3mm
Bogdan Blidaru Particle tracking and identification at high rates WS 16/17 Page 54
the pad. Ions are created exclusively on top of the wire radial position of the ions is fixed.
what the signal induced on the pad plane will look like if there is a charge at a certain height.
pad plane wire pad
Bogdan Blidaru Particle tracking and identification at high rates WS 16/17 Page 55
Bogdan Blidaru Particle tracking and identification at high rates WS 16/17 Page 56
Drift lines of the ions
Corresponding ion signals induced on the pads depends on the applied voltage Depending on gain, different fractions of the ions end up on pads, cathode or gate or are drifted away; we can get positive or negative signal depending
drifting
Ion tails Induced signal in the pad plane has 2 parts: fast part (used to determine the track properties, dE/dx, …) and a slow part (that leads to the deterioration of the performance). The main signal is on the background of the following signal.
Bogdan Blidaru Particle tracking and identification at high rates WS 16/17 Page 57
Comparison of the measured and simulated signal shapes in five pads of a cluster where pad number 3 is the center of the cluster. Upper panel: pulse shape Lower panel: ion-tail Left: data Right: Garfield simulations
Bogdan Blidaru Particle tracking and identification at high rates WS 16/17 Page 58
3ADC threshold – whatever is below is not detected in the following reconstruction
Bogdan Blidaru Particle tracking and identification at high rates WS 16/17 Page 59
Subject to contamination from other particles
Has to be known very precise (0.2%) Different ways dE/dx is used for PID:
Bogdan Blidaru Particle tracking and identification at high rates WS 16/17 Page 60
Bogdan Blidaru Particle tracking and identification at high rates WS 16/17 Page 61
Bogdan Blidaru Particle tracking and identification at high rates WS 16/17 Page 62
Bogdan Blidaru Particle tracking and identification at high rates WS 16/17 Page 63
Bogdan Blidaru Particle tracking and identification at high rates WS 16/17 Page 64
Bogdan Blidaru Particle tracking and identification at high rates WS 16/17 Page 65
(pad by pad) (time dependent corrections)
Bogdan Blidaru Particle tracking and identification at high rates WS 16/17 Page 66
account only the first 60%.
threshold are also used in the algorithm. The missing clusters are clusters not observed, but with observed cluster in two adjacent
two sided truncated mean. In ALICE no lower threshold is used, since this provokes a decrease in separation power.
60%
To disentangle between signal & noise (@2ADC) Signal below threshold (must be considered in order not to bias dE/dx)
Bogdan Blidaru Particle tracking and identification at high rates WS 16/17 Page 67
Bogdan Blidaru Particle tracking and identification at high rates WS 16/17 Page 68
Bogdan Blidaru Particle tracking and identification at high rates WS 16/17 Page 69
Transfer function ~5% spread Goal: 0.2%
Bogdan Blidaru Particle tracking and identification at high rates WS 16/17 Page 70
Bogdan Blidaru Particle tracking and identification at high rates WS 16/17 Page 71