
SLIDE 1
Shale gas and CBM in Europe Shale-shocked Europe and shale gas The - - PowerPoint PPT Presentation
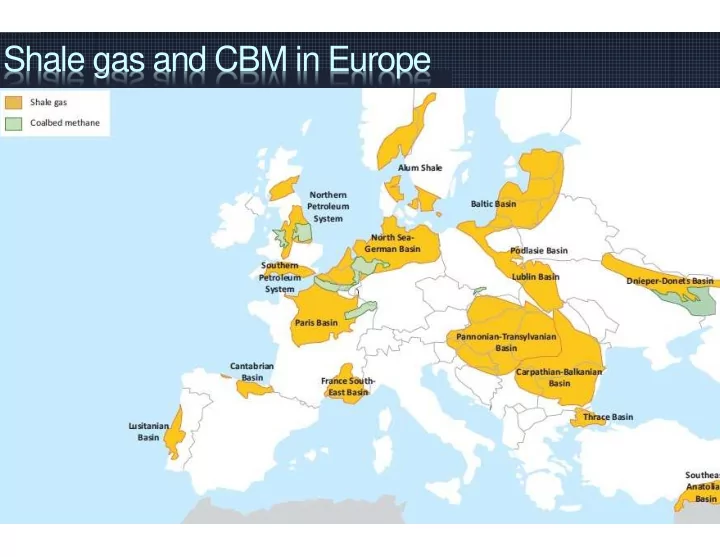
Shale gas and CBM in Europe Shale-shocked Europe and shale gas The Economist, Feb 2nd 2013 Renewable capacity additions Renewables Gain Share United States Europe Asia Pacific Percent of TWh Percent of TWh Percent of TWh 45 45 45
The Economist, Feb 2nd 2013
5 10 15 20 25 30 35 40 45 '10 '20 '30 '40 5 10 15 20 25 30 35 40 45 '10 '20 '30 '40 5 10 15 20 25 30 35 40 45 '10 '20 '30 '40
Solar Geothermal Biomass/Other Wind Hydro
United States
Percent of TWh
Europe
Percent of TWh
Asia Pacific
Percent of TWh *Biomass includes Municipal Solid Waste
ExxonMobil 2013 Outlook for Energy
5 10 15 20 25 30 35 2005 2006 2007 2008 2009 2010 2011 2012 2013 U.S. - Henry Hub Japan - LNG France - PEG Canada - AECO Germany - BEB Hub Netherlands - TTF Belgium - Zeebrugge Brent crude oil UK - NBP
Spot natural gas prices vary significantly acr global markets since 2008, with many marke far below oil-related benchmarks
Traditional: Middle East, Persian Gulf, Saudi Ara New rivals to Saudi Arabia and the Arab World (
Proliferation of suppliers large enough to negati
20 40 60 80 100 120 1980 1985 1990 1995 2000 2005 2010 2015 2020 2025 2030 2035 2040
U.S. primary energy consumption quadrillion Btu
History Projections 2011 36% 20% 26% 8% 8% 1% 32% 28% 19% 11% 9% 2% Shares of total U.S. energy Nuclear Oil and other liquids Liquid biofuels Natural gas Coal Renewables (excluding liquid biofuels) 2000 23% 39% 24% 6% 8%
U.S. crude oil and lease condensate resources in non-prohibited areas billion barrels
(1) The USGS reduced NPR-A resource estimates, which is responsible for the lower AEO2013 Alaska resources. (2) Prior to AEO2009, resources in Pacific, Atlantic, and Eastern GOM OCS were under moratoria and not included. (3) Includes shale oil. Prior to AEO2011, tight oil is included in unproved other lower-48 onshore category.
50 100 150 200 250 2000 2001 2002 2003 2004 2005 2006 2007 2008 2009 2010 2011 2012 2013
Year of Annual Energy Outlook
Unproved Alaska (1) Unproved L48 Offshore (2) Unproved Tight Oil (3) Unproved Tight Oil (reclassified from onshore) Unproved Other L48 Onshore Proved Reserves
23.8 48.6 41.6 16.5 67.0 25.2 222.6
Multiple factors have contributed to U.S. crud resource estimate incr
contributing recently
Primary Energy Sources: Primary Energy Sources: Primary Energy Sources: Primary Energy Sources:
Extraction & Conversion Technologies: Extraction & Conversion Technologies: Extraction & Conversion Technologies: Extraction & Conversion Technologies:
End Use Technologies: End Use Technologies: End Use Technologies: End Use Technologies:
There are no “silver bullets” There are no “silver bullets” There are no “silver bullets” There are no “silver bullets”
impact at the lowest cost
educated decision makers and an educated public
a level playing field for all applicable technologies emissions trading
market shares are likely to roughly equalize, at 25% to 30% each. This would be the first time in histor that the world has not been dominated by one single fuel
US electricity could be renewable by 2050
increase in the share of non-fossil fuel primary energy consumption
production, transformation, transmission and distribution: great strides being made NOT through socia engineering (self-sacrifice) but through technological innovation (in building, manufacturing, transportation and other sectors – urbanization offers great promise here.
the smallest since the beginning of the industrial revolution
(2.5 trillion barrels of oil equivalent)
foresight
scanning
foresight Report strategic foresight
Process Product Decision- making
Report Threat-picture Report themes and scenarios Cabinet decides on themes for thematic in-depth analyses
risk- assessment National Risk Picture
Legisla Risk prioritization Measu Polic Planning assumpti
programme tasks and capabilities
Required capabilies Current capabiliities Capabilities gap Capability- requirement Werk
priorities on basis of national risk picture Cabinet decides
be strengthened through normal budget system
Foresight Risk assessment Capabilities planning
Risk Profile
Likelihood Impact
(multi-criteria analysis)
(Threats & Hazards)
Hazards
A < 0,05 Highly improbable B 0.05 – 0.5 Improbable C 0.5 – 5 Possible D 5 – 50 Probable E 50 – 100 Highly probable Dangers
A No concrete indication, and event is thought to be inconceivable B No concrete indication, but event is conceivable C No concrete indication, but event is conceivable D Event is thought to be quite probable E Concrete indication event will occur Dangers Hazards ikelihood
Scenario incident(s) Territorial security Human security Economic security Ecological security Political and social sta Total Impact Score of the scenario
Territory International position Fatalities Disruption to daily life Integrity of democracy Long-term disruption Casualties Suffering Costs
Weighted Aggregation
(+flooding and flu));
radicalization;
infrastructure;
and upperworld;
chemical and nuclear accident).
5 10 15 20 25 30 35 40 45 50
Grieppandemie mild Grieppandemie ernstig Hitte-droogte Zware sneeuwstorm IJzel Zeer zware storm Overstroming Westelijke kust (EDO) Overstroming Dijkring 14 Overstroming Rijn-IJssel Landelijke black-out elektriciteit Moedwillige verstoring elektriciteit Oliegeopolitiek Moedwillige verstoring gaslevering Moedwillige langdurige elektriciteitsuitval Moedwillige verstoring ICT vitale sector Verstoring IP-netwerk Rechts-extremisme Links-extremisme Dierenrechtenactivisme Politiek salafisme Moslimextremisme Onrust in probleemwijken Confrontaties allochtonen – extreem rechts Massapolarisatie Dierenrechtenextremisme Enclavevorming Politiek salafisme met geweld Beïnvloeding openbaar bestuur Beïnvloeding aandelenmarkt Criminele inmenging in vitaal bedrijfsleven Natuurbranden Chemisch incident Nucleair incident Cyberconflict Mineraal geopolitiek Spoorwegongeval Maritiemongeval Voedselschaarste (sojabonen) Uitval Internet Exchange
Waarschijnlijkheid Integriteit grondgebied Integriteit internationale positie Doden Gewonden en chronische zieken Gebrek primaire levensbehoeften Kosten Milieu en natuur Verstoring dagelijks leven Democratische rechtstaat Sociaalpsychologisch
5 10 15 20 25 30
Landelijke black-out elektriciteit Moedwillige verstoring elektriciteit Oliegeopolitiek Moedwillige verstoring gaslevering Moedwillige langdurige elektriciteitsuitval
Waarschijnlijkheid Integriteit grondgebied Integriteit internationale positie Doden Gewonden en chronische zieken Gebrek primaire levensbehoeften Kosten Milieu en natuur Verstoring dagelijks leven Democratische rechtstaat Sociaalpsychologisch
Whole-of- Government Whole-of- Government Stovepiped Internal security External security Whole-of- Society Integrated security approach Whole-of- Society