
SLIDE 1
10/27/2008 1
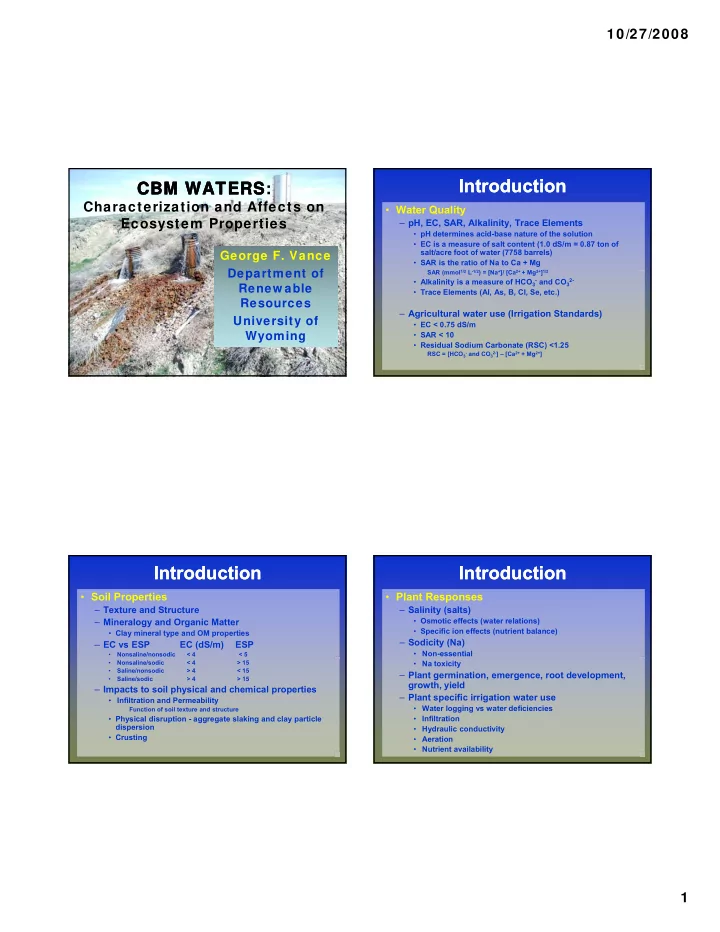
CBM WATERS CBM WATERS CBM WATERS CBM WATERS:
Characterization and Affects on Ecosystem Properties
George F. Vance Department of Department of Renew able Resources University of Wyoming
Introduction Introduction
- Water Quality
– pH, EC, SAR, Alkalinity, Trace Elements
- pH determines acid-base nature of the solution
- EC is a measure of salt content (1.0 dS/m = 0.87 ton of
salt/acre foot of water (7758 barrels)
- SAR is the ratio of Na to Ca + Mg
SAR (mmol1/2 L-1/2) = [Na+]/ [Ca2+ + Mg2+]1/2 SAR (mmol1/2 L 1/2) = [Na+]/ [Ca2+ + Mg2+]1/2
- Alkalinity is a measure of HCO3
- and CO3
2-
- Trace Elements (Al, As, B, Cl, Se, etc.)
– Agricultural water use (Irrigation Standards)
- EC < 0.75 dS/m
- SAR < 10
- Residual Sodium Carbonate (RSC) <1.25
RSC = [HCO3
- and CO3
2-] – [Ca2+ + Mg2+]
Introduction Introduction
- Soil Properties
– Texture and Structure – Mineralogy and Organic Matter
- Clay mineral type and OM properties
– EC vs ESP EC (dS/m) ESP
- Nonsaline/nonsodic
< 4 < 5
- Nonsaline/sodic
< 4 > 15
- Saline/nonsodic
> 4 < 15
- Saline/sodic
> 4 > 15
– Impacts to soil physical and chemical properties
- Infiltration and Permeability
Function of soil texture and structure
- Physical disruption - aggregate slaking and clay particle
dispersion
- Crusting
Introduction Introduction
- Plant Responses
– Salinity (salts)
- Osmotic effects (water relations)
- Specific ion effects (nutrient balance)
– Sodicity (Na)
- Non-essential
- Na toxicity
– Plant germination, emergence, root development, growth, yield – Plant specific irrigation water use
- Water logging vs water deficiencies
- Infiltration
- Hydraulic conductivity
- Aeration
- Nutrient availability