
SLIDE 1
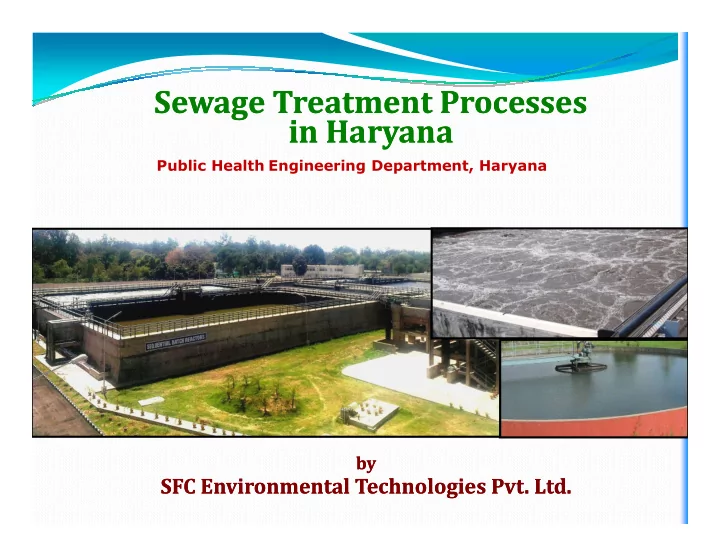
Sewage Treatment Processes Sewage Treatment Processes in Haryana in Haryana
by by
SFC Environmental Technologies SFC Environmental Technologies Pvt.
- Pvt. Ltd.
Sewage Treatment Processes Sewage Treatment Processes in Haryana - - PowerPoint PPT Presentation
Sewage Treatment Processes Sewage Treatment Processes in Haryana in Haryana by by SFC Environmental
by by
TOTAL POPULATION AS PER 2011 CENSUS
URBAN URBAN RURAL
60 80 100 120
Urban Population in crores
20 40 2011 2021 2031 2041 2051 Year
60000 80000 100000 120000
Estimated sewage generation, MLD
20000 40000 60000 2011 2021 2031 2041 2051 Year
STP Capacity as on 2009 - 11553
GAP
Ref Ref : : CPCB CPCB Report Report on
Performance Evaluation Evaluation of
STPs, 2013 2013
Urban Population
Sewage generation, MLD
Sewage Treated, MLD
Gap, MLD
Ref : National Capital Region Planning Board (NCRPB) Report, Ministry of Urban Development, GoI
400 MLD sewage goes untreated into water bodies / drains / rivers
Suspended Dissolved Suspended Dissolved
Plastic bags
Sand Grit
Floating material/ Large suspended matter Sand/ Grit Oil & Grease Chokes pumps/ pipes Silting in tanks/ receiving bodies Floating scum/ sticking to tanks
Oil & Grease Suspended Solids Organic matter (BOD/COD) Nitrogen Phosporous Floating scum/ sticking to tanks & pipes Silting & septicity Septicity/ odour/ depletion of DO Growth of aquatic plants Growth of aquatic plants
BOD Biological Oxygen Demand COD Chemical Oxygen Demand
Suspended Dissolved Suspended Dissolved
BOD is amount of oxygen required by bacteria to degrade
COD is amount of oxygen required by chemicals to degrade organic matter
Parameter Raw CPCB BOD5, mg/L 250-300 < 30 COD, mg/L 400-550 < 250 TSS, mg/L 300-600 < 100 Turbidity, NTU
35-45 < 50 State PCB < 30 < 250 < 100
MoUD < 10
< 10
35-45 < 50 TN, mg/L 40-50
5-8 < 5 pH 5.5 to 8.5 5.5 to 9.0 Faecal Coliforms (MPN/100 ml) 106
Chlorine, mg/L
< 50
5.5 to 9.0
< 2
Nil < 1
100 150 200 250 % Design Flow
DAILY FLOW VARIATIONS OF RAW SEWAGE Peak Flow – 2.25 times Peak Flow Average Flow
50 1 2 3 4 5 6 7 8 9 10 11 12 13 14 15 16 17 18 19 20 21 22 23 24 25 Hrs
Lean Flow – 0.5 times Pumps have to be designed to cater to both peak and average flow.
FINE SCREENING GRIT REMOVAL
GRIT
RAW SEWAGE
INLET CHAMBER RAW SEWAGE PUMPING COARSE SCREENING
RAW SEWAGE PUMPING STATION PRIMARY TREATMENT
AERATION TANK SECONDARY CLARIFIER
TREATED WATER
DISINFECTION
CHLORINE
SLUDGE RECIRCULATION AIR BLOWER
RAW SEWAGE PUMPING STATION PRIMARY TREATMENT SECONDARY TREATMENT TERTIARY TREATMENT
SLUDGE SUMP CENTRIFUGE
SLUDGE
SLUDGE DEWATERING
SURPLUS SLUDGE
CENTRATE TO AT
BOD/COD SURPLUS SLUDGE MLSS
(SLUDGE)