SLIDE 1 Sequences are related
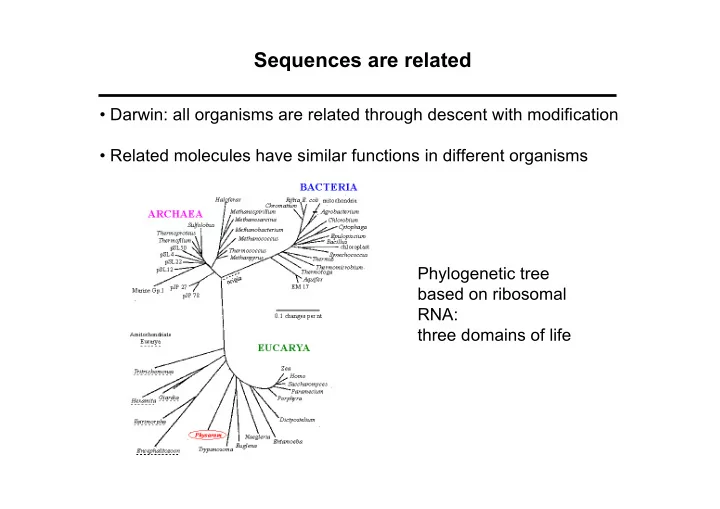
- Darwin: all organisms are related through descent with modification
- Related molecules have similar functions in different organisms
Phylogenetic tree based on ribosomal RNA: three domains of life
SLIDE 2 Sequences are related, II
Phylogenetic tree
proteins found in humans
SLIDE 3 Why compare sequences?
evolutionary relationships
function and structure (database searches). Protein 1: binds oxygen Sequence similarity Protein 2: binds oxygen ?
SLIDE 4
Dotplots: visual sequence comparison
1. Place two sequences along axes of plot 2. Place dot at grid points where two sequences have identical residues 3. Diagonals correspond to conserved regions
SLIDE 5
Pairwise alignments
43.2% identity; Global alignment score: 374 10 20 30 40 50 alpha V-LSPADKTNVKAAWGKVGAHAGEYGAEALERMFLSFPTTKTYFPHF-DLS-----HGSA : :.: .:. : : :::: .. : :.::: :... .: :. .: : ::: :. beta VHLTPEEKSAVTALWGKV--NVDEVGGEALGRLLVVYPWTQRFFESFGDLSTPDAVMGNP 10 20 30 40 50 60 70 80 90 100 110 alpha QVKGHGKKVADALTNAVAHVDDMPNALSALSDLHAHKLRVDPVNFKLLSHCLLVTLAAHL .::.::::: :.....::.:.. .....::.:: ::.::: ::.::.. :. .:: :. beta KVKAHGKKVLGAFSDGLAHLDNLKGTFATLSELHCDKLHVDPENFRLLGNVLVCVLAHHF 60 70 80 90 100 110 120 130 140 alpha PAEFTPAVHASLDKFLASVSTVLTSKYR :::: :.:. .: .:.:...:. ::. beta GKEFTPPVQAAYQKVVAGVANALAHKYH 120 130 140
SLIDE 6
Pairwise alignment
Percent identity is not a good measure of alignment quality
100.000% identity in 3 aa overlap SPA ::: SPA
SLIDE 7
Pairwise alignments: alignment score
43.2% identity; Global alignment score: 374 10 20 30 40 50 alpha V-LSPADKTNVKAAWGKVGAHAGEYGAEALERMFLSFPTTKTYFPHF-DLS-----HGSA : :.: .:. : : :::: .. : :.::: :... .: :. .: : ::: :. beta VHLTPEEKSAVTALWGKV--NVDEVGGEALGRLLVVYPWTQRFFESFGDLSTPDAVMGNP 10 20 30 40 50 60 70 80 90 100 110 alpha QVKGHGKKVADALTNAVAHVDDMPNALSALSDLHAHKLRVDPVNFKLLSHCLLVTLAAHL .::.::::: :.....::.:.. .....::.:: ::.::: ::.::.. :. .:: :. beta KVKAHGKKVLGAFSDGLAHLDNLKGTFATLSELHCDKLHVDPENFRLLGNVLVCVLAHHF 60 70 80 90 100 110 120 130 140 alpha PAEFTPAVHASLDKFLASVSTVLTSKYR :::: :.:. .: .:.:...:. ::. beta GKEFTPPVQAAYQKVVAGVANALAHKYH 120 130 140
SLIDE 8
Alignment scores: match vs. mismatch
Simple scoring scheme (too simple in fact…): Matching amino acids: 5 Mismatch: Scoring example:
K A W S A D V : : : : : K D W S A E V 5+0+5+5+5+0+5 = 25
SLIDE 9
Pairwise alignments: conservative substitutions
43.2% identity; Global alignment score: 374 10 20 30 40 50 alpha V-LSPADKTNVKAAWGKVGAHAGEYGAEALERMFLSFPTTKTYFPHF-DLS-----HGSA : :.: .:. : : :::: .. : :.::: :... .: :. .: : ::: :. beta VHLTPEEKSAVTALWGKV--NVDEVGGEALGRLLVVYPWTQRFFESFGDLSTPDAVMGNP 10 20 30 40 50 60 70 80 90 100 110 alpha QVKGHGKKVADALTNAVAHVDDMPNALSALSDLHAHKLRVDPVNFKLLSHCLLVTLAAHL .::.::::: :.....::.:.. .....::.:: ::.::: ::.::.. :. .:: :. beta KVKAHGKKVLGAFSDGLAHLDNLKGTFATLSELHCDKLHVDPENFRLLGNVLVCVLAHHF 60 70 80 90 100 110 120 130 140 alpha PAEFTPAVHASLDKFLASVSTVLTSKYR :::: :.:. .: .:.:...:. ::. beta GKEFTPPVQAAYQKVVAGVANALAHKYH 120 130 140
SLIDE 10
Amino acid properties
Serine (S) and Threonine (T) have similar physicochemical properties Aspartic acid (D) and Glutamic acid (E) have similar properties Substitution of S/T or E/D should result in scores that are only moderately lower than identities =>
SLIDE 11 Protein substitution matrices
A 5 R -2 7 N -1 -1 7 D -2 -2 2 8 C -1 -4 -2 -4 13 Q -1 1 0 0 -3 7 E -1 0 0 2 -3 2 6 G 0 -3 0 -1 -3 -2 -3 8 H -2 0 1 -1 -3 1 0 -2 10 I -1 -4 -3 -4 -2 -3 -4 -4 -4 5 L -2 -3 -4 -4 -2 -2 -3 -4 -3 2 5 K -1 3 0 -1 -3 2 1 -2 0 -3 -3 6 M -1 -2 -2 -4 -2 0 -2 -3 -1 2 3 -2 7 F -3 -3 -4 -5 -2 -4 -3 -4 -1 0 1 -4 0 8 P -1 -3 -2 -1 -4 -1 -1 -2 -2 -3 -4 -1 -3 -4 10 S 1 -1 1 0 -1 0 -1 0 -1 -3 -3 0 -2 -3 -1 5 T 0 -1 0 -1 -1 -1 -1 -2 -2 -1 -1 -1 -1 -2 -1 2 5 W -3 -3 -4 -5 -5 -1 -3 -3 -3 -3 -2 -3 -1 1 -4 -4 -3 15 Y -2 -1 -2 -3 -3 -1 -2 -3 2 -1 -1 -2 0 4 -3 -2 -2 2 8 V 0 -3 -3 -4 -1 -3 -3 -4 -4 4 1 -3 1 -1 -3 -2 0 -3 -1 5 A R N D C Q E G H I L K M F P S T W Y V
BLOSUM50 matrix:
- Positive scores on diagonal
(identities)
- Similar residues get higher
scores
- Dissimilar residues get smaller
(negative) scores
SLIDE 12
Pairwise alignments: insertions/deletions
43.2% identity; Global alignment score: 374 10 20 30 40 50 alpha V-LSPADKTNVKAAWGKVGAHAGEYGAEALERMFLSFPTTKTYFPHF-DLS-----HGSA : :.: .:. : : :::: .. : :.::: :... .: :. .: : ::: :. beta VHLTPEEKSAVTALWGKV--NVDEVGGEALGRLLVVYPWTQRFFESFGDLSTPDAVMGNP 10 20 30 40 50 60 70 80 90 100 110 alpha QVKGHGKKVADALTNAVAHVDDMPNALSALSDLHAHKLRVDPVNFKLLSHCLLVTLAAHL .::.::::: :.....::.:.. .....::.:: ::.::: ::.::.. :. .:: :. beta KVKAHGKKVLGAFSDGLAHLDNLKGTFATLSELHCDKLHVDPENFRLLGNVLVCVLAHHF 60 70 80 90 100 110 120 130 140 alpha PAEFTPAVHASLDKFLASVSTVLTSKYR :::: :.:. .: .:.:...:. ::. beta GKEFTPPVQAAYQKVVAGVANALAHKYH 120 130 140
SLIDE 13 Alignment scores: insertions/deletions
K L A A S V I L S D A L K L A A - - - - S D A L
Affine gap penalties: Multiple insertions/deletions may be one evolutionary event => Separate penalties for gap opening and gap elongation
SLIDE 14
Handout
Compute 4 alignment scores: two different alignments using two different alignment matrices (and the same gap penalty system) Score 1: Alignment 1 + BLOSUM-50 matrix + gaps Score 2: Alignment 1 + BLOSUM-Trp matrix + gaps Score 3: Alignment 2 + BLOSUM-50 matrix + gaps Score 4: Alignment 2 + BLOSUM-Trp matrix + gaps
SLIDE 15
Handout: summary of results Alignment 2 Alignment 1
BLOSUM-50 BLOSUM-Trp
SLIDE 16 Protein substitution matrices
A 5 R -2 7 N -1 -1 7 D -2 -2 2 8 C -1 -4 -2 -4 13 Q -1 1 0 0 -3 7 E -1 0 0 2 -3 2 6 G 0 -3 0 -1 -3 -2 -3 8 H -2 0 1 -1 -3 1 0 -2 10 I -1 -4 -3 -4 -2 -3 -4 -4 -4 5 L -2 -3 -4 -4 -2 -2 -3 -4 -3 2 5 K -1 3 0 -1 -3 2 1 -2 0 -3 -3 6 M -1 -2 -2 -4 -2 0 -2 -3 -1 2 3 -2 7 F -3 -3 -4 -5 -2 -4 -3 -4 -1 0 1 -4 0 8 P -1 -3 -2 -1 -4 -1 -1 -2 -2 -3 -4 -1 -3 -4 10 S 1 -1 1 0 -1 0 -1 0 -1 -3 -3 0 -2 -3 -1 5 T 0 -1 0 -1 -1 -1 -1 -2 -2 -1 -1 -1 -1 -2 -1 2 5 W -3 -3 -4 -5 -5 -1 -3 -3 -3 -3 -2 -3 -1 1 -4 -4 -3 15 Y -2 -1 -2 -3 -3 -1 -2 -3 2 -1 -1 -2 0 4 -3 -2 -2 2 8 V 0 -3 -3 -4 -1 -3 -3 -4 -4 4 1 -3 1 -1 -3 -2 0 -3 -1 5 A R N D C Q E G H I L K M F P S T W Y V
BLOSUM50 matrix:
- Positive scores on diagonal
(identities)
- Similar residues get higher
scores
- Dissimilar residues get smaller
(negative) scores
SLIDE 17 Protein substitution matrices: different types
(match vs. mismatch)
(how similar are the codons?)
- Chemical properties matrix
(use knowledge of physicochemical properties to design matrix)
(based on observed pair-frequencies in hand-made alignments) PAM series BLOSUM series Gonnet
SLIDE 18 Estimation of the BLOSUM 50 matrix
- For each alignment in the BLOCKS
database the sequences are grouped into clusters with at least 50% identical residues (for BLOSUM 50)
- All pairs of sequences are compared,
and the observed pair frequencies are noted (e.g., A aligned with A makes up 1.5% of all pairs. A aligned with C makes up 0.01% of all pairs, etc.)
- Expected pair frequencies are
computed from single amino acid
- frequencies. (e.g, fA,C=fA x fC=7% x 3%
= 0.21%).
- For each amino acid pair the
substitution scores are essentially computed as:
ID FIBRONECTIN_2; BLOCK COG9_CANFA GNSAGEPCVFPFIFLGKQYSTCTREGRGDGHLWCATT COG9_RABIT GNADGAPCHFPFTFEGRSYTACTTDGRSDGMAWCSTT FA12_HUMAN LTVTGEPCHFPFQYHRQLYHKCTHKGRPGPQPWCATT HGFA_HUMAN LTEDGRPCRFPFRYGGRMLHACTSEGSAHRKWCATTH MANR_HUMAN GNANGATCAFPFKFENKWYADCTSAGRSDGWLWCGTT MPRI_MOUSE ETDDGEPCVFPFIYKGKSYDECVLEGRAKLWCSKTAN PB1_PIG AITSDDKCVFPFIYKGNLYFDCTLHDSTYYWCSVTTY SFP1_BOVIN ELPEDEECVFPFVYRNRKHFDCTVHGSLFPWCSLDAD SFP3_BOVIN AETKDNKCVFPFIYGNKKYFDCTLHGSLFLWCSLDAD SFP4_BOVIN AVFEGPACAFPFTYKGKKYYMCTRKNSVLLWCSLDTE SP1_HORSE AATDYAKCAFPFVYRGQTYDRCTTDGSLFRISWCSVT COG2_CHICK GNSEGAPCVFPFIFLGNKYDSCTSAGRNDGKLWCAST COG2_HUMAN GNSEGAPCVFPFTFLGNKYESCTSAGRSDGKMWCATT COG2_MOUSE GNSEGAPCVFPFTFLGNKYESCTSAGRNDGKVWCATT COG2_RABIT GNSEGAPCVFPFTFLGNKYESCTSAGRSDGKMWCATS COG2_RAT GNSEGAPCVFPFTFLGNKYESCTSAGRNDGKVWCATT COG9_BOVIN GNADGKPCVFPFTFQGRTYSACTSDGRSDGYRWCATT COG9_HUMAN GNADGKPCQFPFIFQGQSYSACTTDGRSDGYRWCATT COG9_MOUSE GNGEGKPCVFPFIFEGRSYSACTTKGRSDGYRWCATT COG9_RAT GNGDGKPCVFPFIFEGHSYSACTTKGRSDGYRWCATT FINC_BOVIN GNSNGALCHFPFLYNNHNYTDCTSEGRRDNMKWCGTT FINC_HUMAN GNSNGALCHFPFLYNNHNYTDCTSEGRRDNMKWCGTT FINC_RAT GNSNGALCHFPFLYSNRNYSDCTSEGRRDNMKWCGTT MPRI_BOVIN ETEDGEPCVFPFVFNGKSYEECVVESRARLWCATTAN MPRI_HUMAN ETDDGVPCVFPFIFNGKSYEECIIESRAKLWCSTTAD PA2R_BOVIN GNAHGTPCMFPFQYNQQWHHECTREGREDNLLWCATT PA2R_RABIT GNAHGTPCMFPFQYNHQWHHECTREGRQDDSLWCATT
Pair-freq(obs) Pair-freq(expected) log 0.01% 0.21% SA,C = log = -1.3
SLIDE 19
Pairwise alignment
Optimal alignment: alignment having the highest possible score given a substitution matrix and a set of gap penalties
SLIDE 20
Pairwise alignment: the problem
The number of possible pairwise alignments increases explosively with the length of the sequences: Two protein sequences of length 100 amino acids can be aligned in approximately 1060 different ways Time needed to test all possibilities is same order of magnitude as the entire lifetime of the universe.
SLIDE 21
Pairwise alignment: the solution
”Dynamic programming” (the Needleman-Wunsch algorithm)
SLIDE 22
Alignment depicted as path in matrix
T C G C A T C C A T C G C A T C C A
TCGCA TC-CA TCGCA T-CCA
SLIDE 23 Alignment depicted as path in matrix
T C G C A T C C A x
Meaning of point in matrix: all residues up to this point have been aligned (but there are many different possible paths). Position labeled “x”: TC aligned with TC
TC TC-- T-C TC
SLIDE 24
Dynamic programming: computation of scores
T C G C A T C C A x Any given point in matrix can only be reached from three possible positions (you cannot “align backwards”). => Best scoring alignment ending in any given point in the matrix can be found by choosing the highest scoring of the three possibilities.
SLIDE 25
Dynamic programming: computation of scores
T C G C A T C C A x Any given point in matrix can only be reached from three possible positions (you cannot “align backwards”). => Best scoring alignment ending in any given point in the matrix can be found by choosing the highest scoring of the three possibilities. score(x,y) = max score(x,y-1) - gap-penalty
SLIDE 26
Dynamic programming: computation of scores
T C G C A T C C A x Any given point in matrix can only be reached from three possible positions (you cannot “align backwards”). => Best scoring alignment ending in any given point in the matrix can be found by choosing the highest scoring of the three possibilities. score(x,y) = max score(x,y-1) - gap-penalty score(x-1,y-1) + substitution-score(x,y)
SLIDE 27
Dynamic programming: computation of scores
T C G C A T C C A x Any given point in matrix can only be reached from three possible positions (you cannot “align backwards”). => Best scoring alignment ending in any given point in the matrix can be found by choosing the highest scoring of the three possibilities. score(x,y) = max score(x,y-1) - gap-penalty score(x-1,y-1) + substitution-score(x,y) score(x-1,y) - gap-penalty
SLIDE 28
Dynamic programming: computation of scores
T C G C A T C C A x Any given point in matrix can only be reached from three possible positions (you cannot “align backwards”). => Best scoring alignment ending in any given point in the matrix can be found by choosing the highest scoring of the three possibilities. Each new score is found by choosing the maximum of three possibilities. For each square in matrix: keep track of where best score came from. Fill in scores one row at a time, starting in upper left corner of matrix, ending in lower right corner. score(x,y) = max score(x,y-1) - gap-penalty score(x-1,y-1) + substitution-score(x,y) score(x-1,y) - gap-penalty
SLIDE 29
Dynamic programming: example
A C G T A 1 -1 -1 -1 C -1 1 -1 -1 G -1 -1 1 -1 T -1 -1 -1 1
Gaps: -2
SLIDE 30
Dynamic programming: example
SLIDE 31
Dynamic programming: example
SLIDE 32
Dynamic programming: example
SLIDE 33
Dynamic programming: example
T C G C A : : : : T C - C A 1+1-2+1+1 = 2
SLIDE 34
Global versus local alignments
Global alignment: align full length of both sequences. (The “Needleman-Wunsch” algorithm). Local alignment: find best partial alignment of two sequences (the “Smith-Waterman” algorithm).
Global alignment Seq 1 Seq 2 Local alignment
SLIDE 35 Local alignment overview
- The recursive formula is changed by adding a fourth
possibility: zero. This means local alignment scores are never negative.
- Trace-back is started at the highest value rather than in
lower right corner
- Trace-back is stopped as soon as a zero is encountered
score(x,y) = max score(x,y-1) - gap-penalty score(x-1,y-1) + substitution-score(x,y) score(x-1,y) - gap-penalty
SLIDE 36
Local alignment: example
SLIDE 37 Substitution matrices and sequence similarity
- Substitution matrices come as series of matrices calculated for
different degrees of sequence similarity (different evolutionary distances).
- ”Hard” matrices are designed for similar sequences
– Hard matrices a designated by high numbers in the BLOSUM series (e.g., BLOSUM80) – Hard matrices yield short, highly conserved alignments
- ”Soft” matrices are designed for less similar sequences
– Soft matrices have low BLOSUM values (45) – Soft matrices yield longer, less well conserved alignments
SLIDE 38
Alignments: things to keep in mind
“Optimal alignment” means “having the highest possible score, given substitution matrix and set of gap penalties”. This is NOT necessarily the biologically most meaningful alignment. Specifically, the underlying assumptions are often wrong: substitutions are not equally frequent at all positions, affine gap penalties do not model insertion/deletion well, etc. Pairwise alignment programs always produce an alignment - even when it does not make sense to align sequences.