
SLIDE 1
Sentinel 1a InSAR image of the Chile Earthquake 1.4 m of range - - PowerPoint PPT Presentation
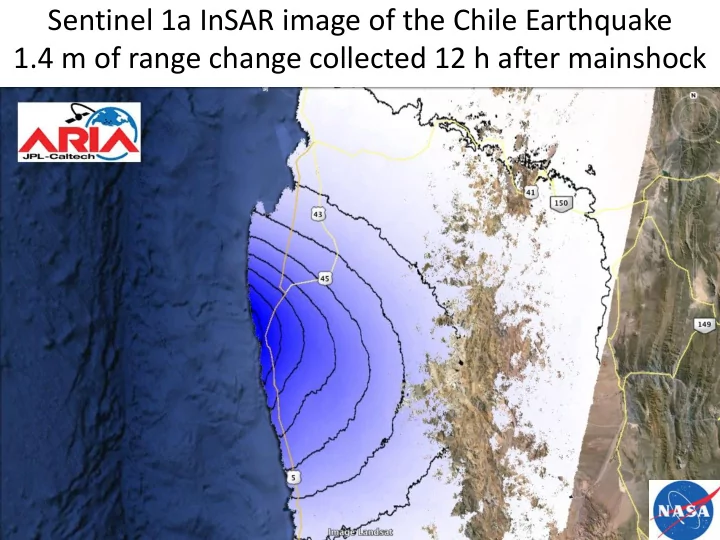
Sentinel 1a InSAR image of the Chile Earthquake 1.4 m of range change collected 12 h after mainshock GPS observed ionospheric signal from both the earthquake and tsunami Tsunami-wave-generated airglow perturbations indicate increased
Tsunami-wave-generated airglow perturbations indicate
by factor of 2 to 4
Multiple peak Multiple peak
Before arrival of tsunami wavefront indicate
and
*Courtesy of NASA’s TIMED/SABER Team
SABER scans* JPL Ionosphere Nat-Haz Team