
SLIDE 1
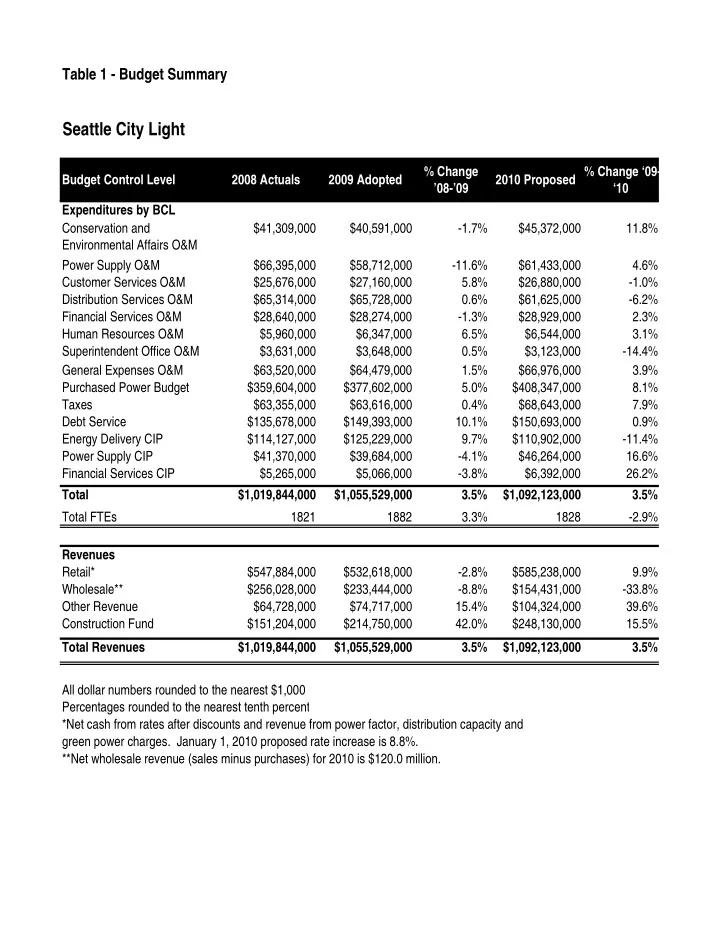
Table 1 - Budget Summary
Seattle City Light
Budget Control Level 2008 Actuals 2009 Adopted % Change ’08-’09 2010 Proposed % Change ‘09- ‘10 Expenditures by BCL Conservation and Environmental Affairs O&M $41,309,000 $40,591,000
- 1.7%
$45,372,000 11.8% Power Supply O&M $66,395,000 $58,712,000
- 11.6%
$61,433,000 4.6% Customer Services O&M $25,676,000 $27,160,000 5.8% $26,880,000
- 1.0%
Distribution Services O&M $65,314,000 $65,728,000 0.6% $61,625,000
- 6.2%
Financial Services O&M $28,640,000 $28,274,000
- 1.3%
$28,929,000 2.3% Human Resources O&M $5,960,000 $6,347,000 6.5% $6,544,000 3.1% Superintendent Office O&M $3,631,000 $3,648,000 0.5% $3,123,000
- 14.4%
General Expenses O&M $63,520,000 $64,479,000 1.5% $66,976,000 3.9% Purchased Power Budget $359,604,000 $377,602,000 5.0% $408,347,000 8.1% Taxes $63,355,000 $63,616,000 0.4% $68,643,000 7.9% Debt Service $135,678,000 $149,393,000 10.1% $150,693,000 0.9% Energy Delivery CIP $114,127,000 $125,229,000 9.7% $110,902,000
- 11.4%
Power Supply CIP $41,370,000 $39,684,000
- 4.1%
$46,264,000 16.6% Financial Services CIP $5,265,000 $5,066,000
- 3.8%
$6,392,000 26.2% Total $1,019,844,000 $1,055,529,000 3.5% $1,092,123,000 3.5% Total FTEs 1821 1882 3.3% 1828
- 2.9%
Revenues Retail* $547,884,000 $532,618,000
- 2.8%
$585,238,000 9.9% Wholesale** $256,028,000 $233,444,000
- 8.8%
$154,431,000
- 33.8%