
SLIDE 1
Sea-Level Projections Eelco J Rohling, ANU
1
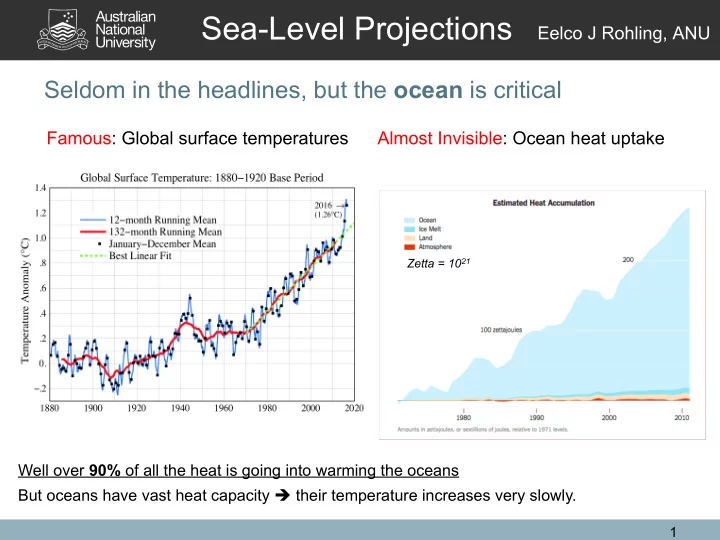
Famous: Global surface temperatures Almost Invisible: Ocean heat uptake
Zetta = 1021
Well over 90% of all the heat is going into warming the oceans But oceans have vast heat capacity è their temperature increases very slowly.