
SLIDE 1
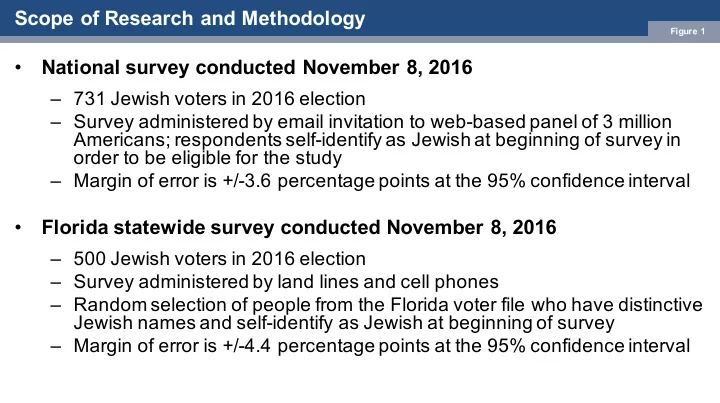
Scope of Research and Methodology
Figure 1
- National survey conducted November 8, 2016
– 731 Jewish voters in 2016 election – Survey administered by email invitation to web-based panel of 3 million Americans; respondents self-identify as Jewish at beginning of survey in
- rder to be eligible for the study
– Margin of error is +/-3.6 percentage points at the 95% confidence interval
- Florida statewide survey conducted November 8, 2016