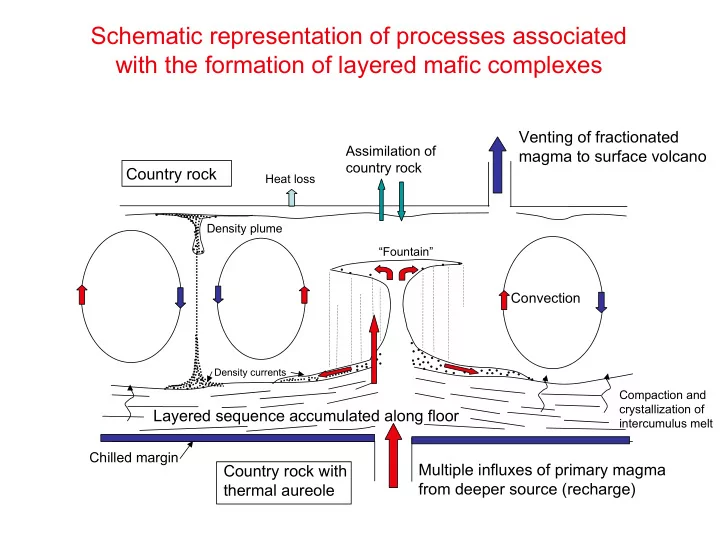
SLIDE 1 Compaction and crystallization of intercumulus melt
Country rock Country rock with thermal aureole Multiple influxes of primary magma from deeper source (recharge)
Chilled margin
Venting of fractionated magma to surface volcano
Schematic representation of processes associated with the formation of layered mafic complexes
Assimilation of country rock
Density plume
Layered sequence accumulated along floor
Convection
Density currents
“Fountain” Heat loss
SLIDE 2 The Skaergård Intrusion in E. Greenland
This intensively studied body of mafic igneous rock is a classic example of extreme closed- system fractional crystallization, e.g.,
Fo70 at bottom of LZ to Fo0 at the top of UZ
After Stewart and DePaolo (1990) Cont. Min. Pet., 104, 125
95 68 67 53 102 89 83 27 4 75 18 34
The numbers on map refer to the location of samples, thin sections
studying in the lab. MBS: Marginal Border Series
SLIDE 3
Cross section through the Skaergaard Intrusion looking down dip
(after Hoover (1978) Carn. Inst. Wash Yb., 77, 732-739
SLIDE 4 After Wager and Brown (1968) Layered Igneous Rocks, and Naslund (1983) J. Petrol., 25, 185-212.
Stratigraphy, major subdivisions, phase layering and cryptic variations in Skaergaard Intrusion Note: (1) the gap in appearance
- f olivine as a cumulus mineral
(no olivine in MZ), (2) restricted range of pigeonite, (3) extreme Fe-enrichment in olivine and cpx, (4) the widespread
- ccurrence of Fe-Ti oxides, (5)
the occurrence of quartz and K- feldspar in granophyres in UZ, (6) the α, β, and γ zones in the UBS correspond (in a rough geochemical sense) to LZ, MZ and UZ, resp., (7) the Sandwich Horizon is actually a thin layer that contains the “dregs” of the fractional crystallization process.
SLIDE 5
Phase equilibria in MgO-FeO-SiO2 system at P = 1 atm (Bowen and Schairer, 1936)
(The experiments were done under strongly reducing conditions in eqm with metallic Fe)
Olivine compositions Pyroxene compositions
Olivine gap 2
3 7 6 8 1 This phase diagram shows the change in Fe/(Fe+Mg) in olivine and pyroxene with progressive fractional crystallization as liquid moves from a → b → c → d → e → 1178.
e
4 5 Ol 1 in eqm with liq a Ol 2 in eqm with liq b (and px 6) Ol 3 in eqm with liq d (and px 8 + sil) Ol 4 in eqm with liq e (and sil) Ol 5 in eqm with liq 1178 (and sil) Px 6 in eqm with liq b (and ol 2) Px 7 in eqm with liq c (and sil) Px 8 in eqm with liq d (and ol 3+ sil) Although this is a simple ternary system, the phase relations provide a realistic view of changing Fe# during fractional crystallization
d: isobaric invariant point. Reaction at d: En + L → Fo + Silica
SLIDE 6 The differentiation of the Skaergaard Intrusion
1939: Publication of Wager and Deer’s “Skaergaard memoir” that apparently presented incontrovertible evidence for extreme Fe enrichment as a result of crystal fractionation in a closed system. This fractionation trend was predicted by Fenner but disputed by Bowen. 1968: Publication of book by Wager and Brown “Layered Igneous Rocks” in which they calculated the compositions of successive liquids using the composition of the chilled margin (EG 4507) as the initial magma and subtracting the computed average bulk compositions of each of the zones in the layered series. They also assumed that the Sandwich Horizon represents a liquid composition and that the granophyres were the last liquid products of fractionation separated by filter pressing. They computed that the Hidden zone formed ~70% of the intrusion. The maximum FeO+Fe2O3 content of ~22% was reached by the liquid at top of UZb. SiO2 content of successive liquids remained below 50% through ~95% of the crystallization.
SiO2 A Liquid comps Crystal extracts
SH Sandwich Horizon MG Melanogranophyre SG Sydtoppen granophyre TS Tinden Sill A=Na2O+K2O F=FeO+0.9Fe2O3 M=MgO
Data from Wager and Brown (1968) Data from Wager and Brown (1968)
SLIDE 7
The differentiation of the Skaergaard Intrusion (cont.)
1987: Hunter and Sparks (CMP, 95, 451) questioned Wager’s calculations (HERESY!!) They noted that such extreme Fe enrichment is not observed in volcanic basalt systems so they set about redoing the calculations. First let’s look at the volcanic data, e.g., Iceland FeO vs SiO2 data for Icelandic tholeiitic systems. Composition of the Iceland flows do not exceed ~15% FeO. The calculated cumulate extracts are those required to model fractionation intervals (ferrobasalt to icelandite to dacite to rhyolite). Compositional fields of FeO-rich basalts from C (flood basalts) and O (oceanic basalts). AFM diagram for Icelandic basalt flows which show less extreme Fe enrichment and substantial amounts of rhyolite.
SLIDE 8 The differentiation of the Skaergaard Intrusion (cont.) Hunter and Sparks (1987) re-calculated Skaergaard magma compositions
FeO vs SiO2:Hunter and Sparks’s recomputed liquid compositions were much less Fe-rich (16 wt. % to 17.5 wt. % FeO). Hunter and Sparks used a new chilled margin composition (KT39) and recalculated the bulk compositions of the major zones. They claimed that including the Fe-Ti oxides was critical. Their fractionated liquid trend was similar to that
- bserved in volcanic sequences, e.g., Loch Ba
AFM plot. The numbers 70-95 indicate the % crystallization. Hunter and Sparks model produced significant amount of dacite and rhyolite liquids—not obvious in field.
SLIDE 9
Summary of AFM digrams
In the middle panel, the calculated liquid-line-of-descent curves for Skaergaard liquids are based on two models. The upper curve is for 50% SiO2 and the lower curve for 52% SiO2 ferrobasalt parent magma compositions.
Data from Wager and Brown (1968)
SLIDE 10 Summary of FeO versus SiO2 diagrams
In the lower panel, the calculated liquid-line-of- descent curves for Skaergaard liquids are based
- n two models. The upper curve is for 50% SiO2
and the lower curve for 52% SiO2 ferrobasalt parent magma compositions. Liquid compositions are those at the top of the zones indicated. LZi is initial LZ liquid calculated by adding the LZ cumulate average to the parental ferrobasalts Figures reproduced from: Hunter, RH and Sparks RSJ (1987) The differentiation of the Skaergaard Intrusion. Contrib. Mineral. Petrol., 95, 451-461
SLIDE 11 Irvine et al. (1998) Geol. Soc.Am. Bull., 110, 1398-1447.
Neil Irvine’s Skaergaard Model