
SLIDE 1
1
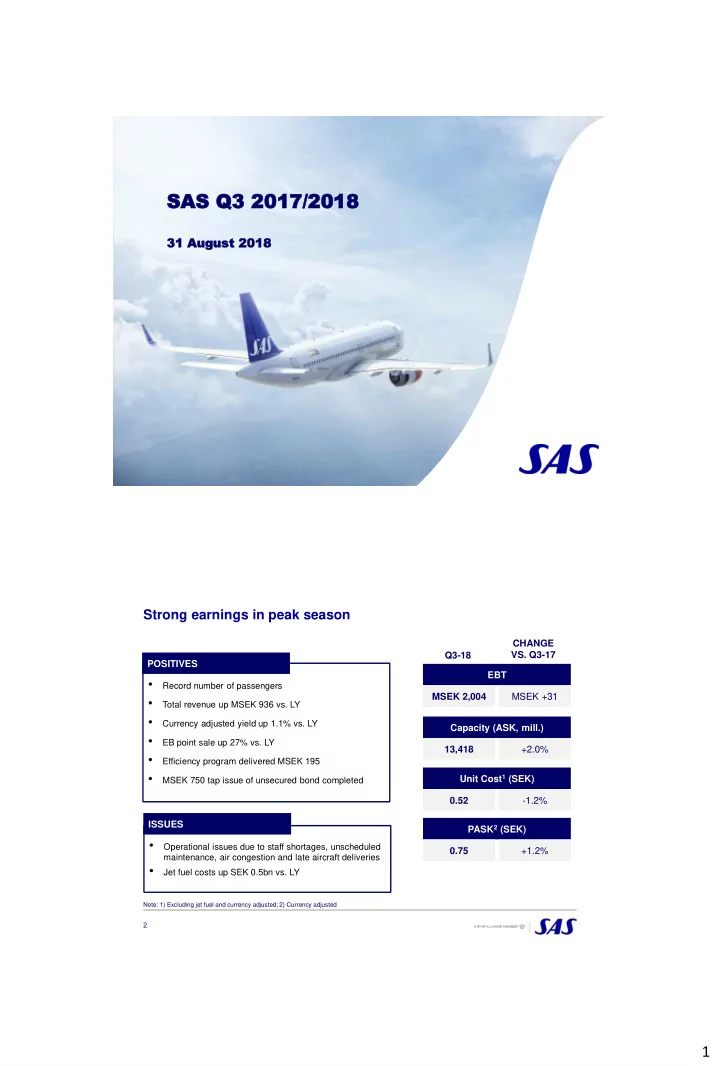
SAS AS Q Q3 3 2017/20 2017/2018 18
31 A 31 August ugust 2018 2018
2
Strong earnings in peak season
Note: 1) Excluding jet fuel and currency adjusted; 2) Currency adjusted
EBT Capacity (ASK, mill.) Unit Cost1 (SEK) PASK2 (SEK) MSEK +31 MSEK 2,004 13,418 0.52 +2.0%
- 1.2%
+1.2% 0.75 Q3-18 CHANGE
- VS. Q3-17
- Record number of passengers
- Total revenue up MSEK 936 vs. LY
- Currency adjusted yield up 1.1% vs. LY
- EB point sale up 27% vs. LY
- Efficiency program delivered MSEK 195
- MSEK 750 tap issue of unsecured bond completed
POSITIVES
- Operational issues due to staff shortages, unscheduled
maintenance, air congestion and late aircraft deliveries
- Jet fuel costs up SEK 0.5bn vs. LY
ISSUES