SAN FRANCISCO SEA LEVEL RISE ACTION PLAN SFMTA May 3 rd , 2016 - - PowerPoint PPT Presentation

san francisco sea level rise action plan
SMART_READER_LITE
LIVE PREVIEW

SAN FRANCISCO SEA LEVEL RISE ACTION PLAN SFMTA May 3 rd , 2016 - - PowerPoint PPT Presentation

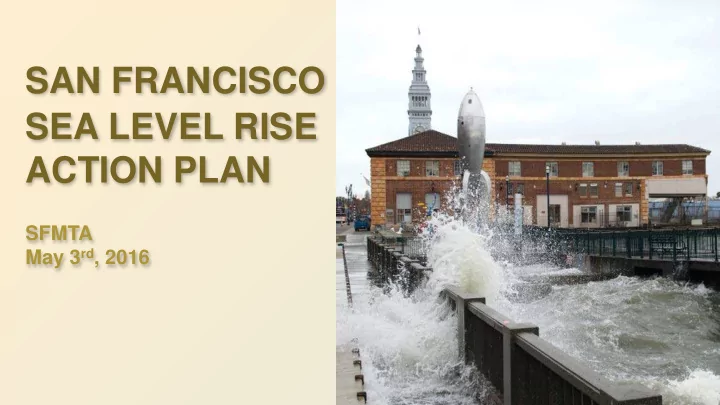
SAN FRANCISCO SEA LEVEL RISE ACTION PLAN SFMTA May 3 rd , 2016 MAYOR EDWIN M. LEE SLR COORDINATING COMMITTEE Co-Chair: Fuad Sweiss, San Francisco Public Works Department Co-Chair: Gil Kelley, San Francisco Planning Department City


slide-1
SLIDE 1

SAN FRANCISCO SEA LEVEL RISE ACTION PLAN

SFMTA May 3rd, 2016

slide-2
SLIDE 2

MAYOR EDWIN M. LEE SLR COORDINATING COMMITTEE

Co-Chair: Fuad Sweiss, San Francisco Public Works Department Co-Chair: Gil Kelley, San Francisco Planning Department City Administrator’s Office San Francisco International Airport San Francisco Public Utilities Commission San Francisco Municipal Transportation Agency Office of Economic and Workforce Development Port of San Francisco Office of Community Investment and Infrastructure Department of Building Inspection Capital Planning

slide-3
SLIDE 3

SAN FRANCISCO SLR PROJECTIONS

Year Most Likely Projection (CEQA/Project Approvals*) Upper Range (Long-range Planning*)

2030 6 in 12 in 2050 11 in 24 in 2100 36 in 66 in

*With Storm Surge + King Tides: add ~ 40” (108” in 2100)

Reference: Sea level rise for the Coasts of California, Oregon, and Washington: Past, Present, and Future (NRC 2012) *Note: the City uses the National Research Council’s (NRC) most likely SLR projection of 36” for ongoing planning and development purposes related to environmental review and project approvals. This Action Plan considers adaptive strategies to address the NRC’s upper end estimate of 66” of SLR by 2100 in the event that future GHG emissions and land ice melting accelerates beyond current predictions.

slide-4
SLIDE 4
slide-5
SLIDE 5

SLR Vulnerability Zone

(Note: blue line marks end

  • f century, upper range

projection with no action)

slide-6
SLIDE 6

COST OF INACTION

Private Property Public Property Total Exposure 66”

(Year 2100)

$19 Billion $35 Billion $54 Billion 108”

(Year 2100 w/storm surge)

$38 Billion $37 Billion $75 Billion

(Note: numbers reflect end of century, upper range projection with no action in today’s dollars)

slide-7
SLIDE 7

PAST AND ONGOING OUTREACH AND ENGAGEMENT EFFORTS

(Note: dotted line marks end

  • f century, upper range

projection with no action)

slide-8
SLIDE 8

COMPLETED STILL NEEDED

 Property/Assets  Port  SFO  SFPUC  Vulnerable Communities  SFMTA Transportation

System

 Other Buildings and

Properties

 Energy, Waste Systems  Parks/Open Space  Communications

VULNERABILITY AND RISK ASSESSMENTS

slide-9
SLIDE 9
slide-10
SLIDE 10

RESILIENCE BY DESIGN CHALLENGE

  • Equitable
  • Collaborative and Interdisciplinary
  • Replicable and Implementable
  • Innovative and Inspiring
  • Community and Design-driven
slide-11
SLIDE 11

LOCAL AND REGIONAL COOPERATION

slide-12
SLIDE 12

ON-GOING COORDINATION

slide-13
SLIDE 13
slide-14
SLIDE 14
slide-15
SLIDE 15

THANK YOU.

Diana Sokolove, Senior Planner Citywide Planning San Francisco Planning Department PH: 415-575-9046 EM: diana.sokolove@sfgov.org