san diego housing commission
play

San Diego Housing Commission Addressing the Housing Affordability - PowerPoint PPT Presentation

San Diego Housing Commission Addressing the Housing Affordability Crisis: San Diego Housing Production Objectives 2018-2028 January 18, 2018 Deborah Ruane Executive Vice President & Chief Strategy Officer San Diego Housing Commission


  1. San Diego Housing Commission “Addressing the Housing Affordability Crisis: San Diego Housing Production Objectives 2018-2028” January 18, 2018 Deborah Ruane Executive Vice President & Chief Strategy Officer San Diego Housing Commission Jenny van der Heyde Senior Policy Analyst San Diego Housing Commission

  2. SDHC – San Diego Housing Production Objectives: 2018-2028 • November 25, 2015: SDHC released “Addressing the Housing Affordability Crisis: Action Plan for San Diego” • 11 recommended actions at the Local, State, and Federal level to reduce costs and increase production • To date, action has occurred on all 11 of the recommendations • This presentation addresses the first of these recommended actions: • City of San Diego set annual housing production goals San Diego Housing Commission Slide #1

  3. SDHC – San Diego Housing Production Objectives: 2018-2028 • SDHC collaborated with Councilmembers Scott Sherman and David Alvarez • Report studied the City’s housing needs and neighborhood-level housing target goals • Report identifies available land, land- use opportunities, and streamlining and process improvements that would enable the City to set realistic and achievable housing production goals San Diego Housing Commission Slide #2

  4. SDHC – San Diego Housing Production Objectives: 2018-2028 • Housing production levels have not kept pace with population growth • Nearly 50 percent of San Diego households are unable to find rental housing they can afford • Approximately 60 percent of San Diego households cannot afford median-priced home ownership • Negative impacts from the low supply of housing: ‒ Quality of life degraded ‒ Environment negatively impacted ‒ Talent available to employers constrained ‒ City revenue lost ‒ Direct construction jobs lost San Diego Housing Commission Slide #3

  5. SDHC – San Diego Housing Production Objectives: 2018-2028 • The San Diego Association of Government’s (SANDAG) 2013-2020 Regional Housing Needs Assessment (RHNA) may not fully identify the City of San Diego’s housing need because it does not include the shortfall in housing production in each year • Comparison with housing production in peer cities identifies additional housing shortfall in the City of San Diego • 17,000 – 24,000 units : Annual production rate needed by 2028 to adequately meet the newly identified demand for housing in the City of San Diego • 6,400 units : Top annual production rate in City of San Diego within the last five years San Diego Housing Commission Slide #4

  6. SDHC – San Diego Housing Production Objectives: 2018-2028 • The City of San Diego has the capacity to meet its housing needs within the next 10 years. • Five main sources for potential new units: 1.Rezoning to increase density around transit hubs 2.Redeveloping underutilized parcels of land 3.Adapting disused industrial zones 4.Infilling vacant lots Geo-spatial analysis: Google map that overlays 5.Utilizing Companion Units each of five sources on City of San Diego San Diego Housing Commission Slide #5

  7. SDHC – San Diego Housing Production Objectives: 2018-2028 Unit Addition from Transit Hub Densification Transit hubs in San Diego SANDAG smart growth hubs and average densities in city Metropolitan Urban 20+ units/acre (low average 25; 7-20 units/acre (average 12) higher average 62) Mira Mesa Mission Valley Town Community Greater North 4-7 unit/acre (average 5.5) 1-3 units/acre (average 2) Park Downtown San Diego Otay Mesa SOURCE: SANDAG GIS Data; SANDAG Smart Growth Map San Diego Housing Commission Slide #6

  8. SDHC – San Diego Housing Production Objectives: 2018-2028 Re-developing Underutilized Land 0% 1-25% 25-50% 50-100% >100% Non multi-family Mira Mesa Clairemont Mesa Mission Valley Normal Heights Greater North Park Downtown San Diego Southeastern San Diego Otay Mesa SOURCE: Geo-Spatial Analysis, SANDAG Geo-SpatialData, McKinsey Global Institute ‘A toolkit to close California’s Housing Gap’ San Diego Housing Commission Slide #7

  9. SDHC – San Diego Housing Production Objectives: 2018-2028 Adaptive Reuse of Disused/City-owned Land Disused/light use Industrial city land parcels MTS highlighted developable land (disused/lightly used parking lots) at 1313/1344 National Ave. SOURCE: SANDAG Geo-Spatial Data San Diego Housing Commission Slide #8

  10. SDHC – San Diego Housing Production Objectives: 2018-2028 Vacant Lots that Can Support Single or Multifamily Dwellings Multi family Single family Pacific Highlands Ranch La Jolla Mission Valley Greater North Park Downtown San Diego Otay Mesa SOURCE: Geo-Spatial Analysis, SANDAG Geo-Spatial Data, McKinsey Global Institute ‘A toolkit to close California’s Housing Gap’ San Diego Housing Commission Slide #9

  11. SDHC – San Diego Housing Production Objectives: 2018-2028 Single-Family Homes in San Diego with Potential for Additional Dwelling Units SOURCE: Geo-Spatial Analysis, SANDAG Geo-Spatial Data, McKinsey Global Institute ‘A toolkit to close California’s Housing Gap’ San Diego Housing Commission Slide #10

  12. SDHC – San Diego Housing Production Objectives: 2018-2028 Annual housing production rate targets for San Diego City , Housing units required per year to meet targets Extrapolated historic peak production (40,000 units per year) 1 30,000 28,000 High-case per year 26,000 24,000 production target 2 24,000 22,000 22,000 20,000 Low-case per year 18,000 production target 3 16,000 16,000 17,000 14,000 15,000 12,000 10,000 11,000 10,000 8,000 8,000 Past 5-year peak production 5,000 (approx. 6,400 units per year) 4 6,000 4,000 2,000 2018 19 20 21 22 23 24 25 26 27 2028 1 Historic high for housing stock growth from 1970 onwards; Average annual rate of 6% housing stock growth (1972-73) applied to current housing stock 2 Based on peer city benchmarks 3 Scaled down high case target, adjusting closer to RHNA magnitude target 4 Average of US census data and SD City data, indicating 12K (2013-14) and 6.5K (2016-17) units per year respectively SOURCE: US Census; Annual Housing Progress Report Outcomes, July 2017 Draft San Diego Housing Commission Slide #11
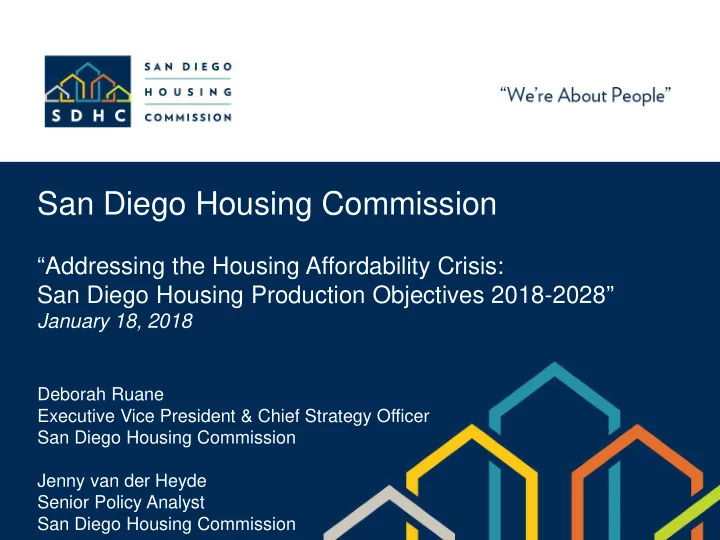
Download Presentation
Download Policy: The content available on the website is offered to you 'AS IS' for your personal information and use only. It cannot be commercialized, licensed, or distributed on other websites without prior consent from the author. To download a presentation, simply click this link. If you encounter any difficulties during the download process, it's possible that the publisher has removed the file from their server.

Recommend


More recommend