
SLIDE 1
SALES HISTORY – SINCE IPO
1
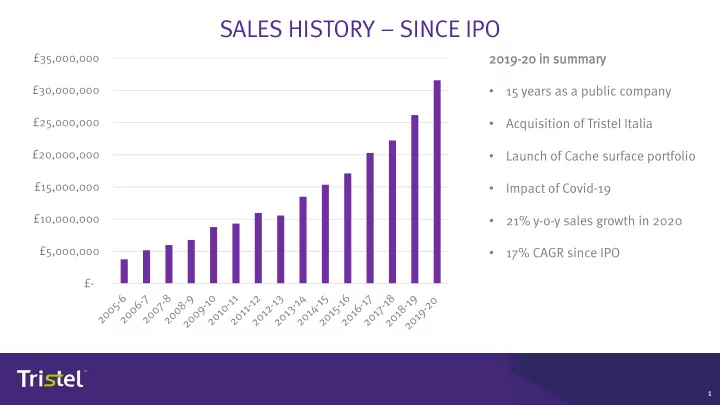
2019 19-20 20 in su summa mary
- 15 years as a public company
- Acquisition of Tristel Italia
- Launch of Cache surface portfolio
- Impact of Covid-19
- 21% y-o-y sales growth in 2020
- 17% CAGR since IPO
1 1
£- £5,000,000 £10,000,000 £15,000,000 £20,000,000 £25,000,000 £30,000,000 £35,000,000