
SLIDE 1
Sale les Pre resentatio ion for Matt’s Mega Mart Object ctiv ives
By the end of this lesson, you will be able to: Apply Theme to presentation Export Word outline to PowerPoint Create pivot charts Modify pivot charts Create a pivot table Change a table to a form Use the top 10 filter Format headings Insert images Convert text to SmartArt You have been asked to create the week 46 sales presentation for Matt’s Mega Mart. You will need to use Excel to format sales data and useful charts, Word to create an outline, and PowerPoint to create the presentation.
Steps:
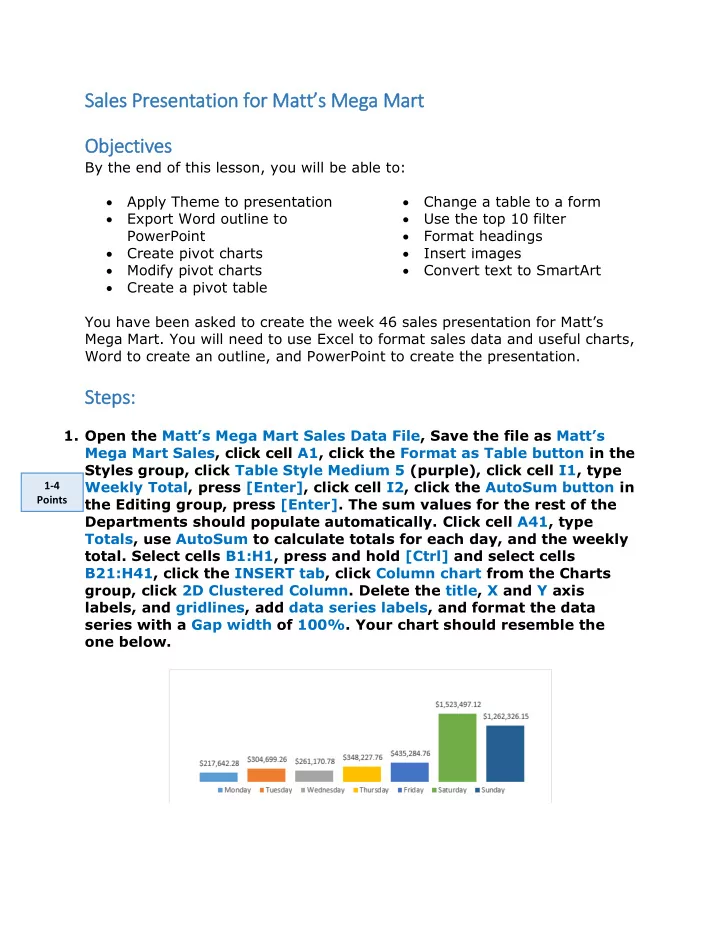
- 1. Open the Matt’s Mega Mart Sales Data File, Save the file as Matt’s
Mega Mart Sales, click cell A1, click the Format as Table button in the Styles group, click Table Style Medium 5 (purple), click cell I1, type Weekly Total, press [Enter], click cell I2, click the AutoSum button in the Editing group, press [Enter]. The sum values for the rest of the Departments should populate automatically. Click cell A41, type Totals, use AutoSum to calculate totals for each day, and the weekly
- total. Select cells B1:H1, press and hold [Ctrl] and select cells
B21:H41, click the INSERT tab, click Column chart from the Charts group, click 2D Clustered Column. Delete the title, X and Y axis labels, and gridlines, add data series labels, and format the data series with a Gap width of 100%. Your chart should resemble the
- ne below.