
SLIDE 1
Ce nte r fo r Ac c e le ra ting Inno va tio n
1
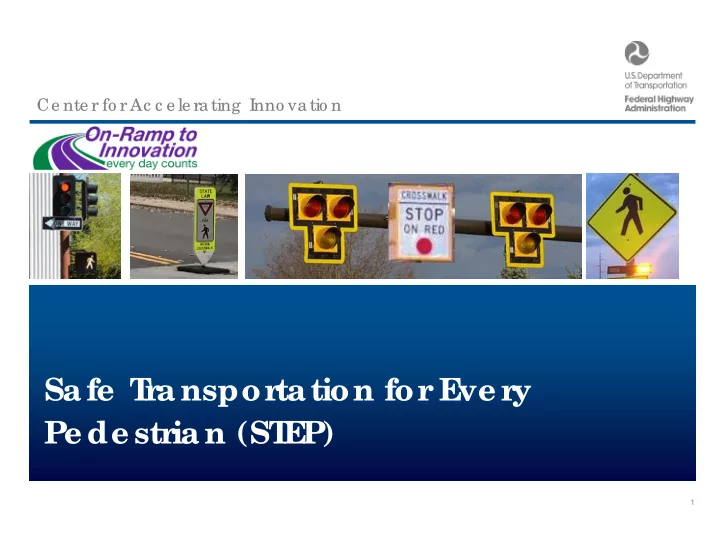
Sa fe T ra nsporta tion for E ve ry Pe de stria n (ST E P) 1 - - PowerPoint PPT Presentation
Ce nte r fo r Ac c e le ra ting Inno va tio n Sa fe T ra nsporta tion for E ve ry Pe de stria n (ST E P) 1 Ce nte r fo r Ac c e le ra ting Inno vatio n 2 Ce nte r fo r Ac c e le ra ting Inno vatio n Source: FHWA Source: FHWA 3 Ce
Ce nte r fo r Ac c e le ra ting Inno va tio n
1
Ce nte r fo r Ac c e le ra ting Inno vatio n 2
Ce nte r fo r Ac c e le ra ting Inno vatio n
3
Source: FHWA Source: FHWA
Ce nte r fo r Ac c e le ra ting Inno vatio n
4
OR
Source: FHWA
Ce nte r fo r Ac c e le ra ting Inno vatio n
Ce nte r fo r Ac c e le ra ting Inno vatio n 6
Ce nte r fo r Ac c e le ra ting Inno vatio n
Initiating 5th Round (2019-2020) - 10 innovations
7
Ce nte r fo r Ac c e le ra ting Inno vatio n
8
Ce nte r fo r Ac c e le ra ting Inno vatio n
Ce nte r fo r Ac c e le ra ting Inno vatio n
Source: FHWA
Give s pe d e stria ns a 3+ se c o nd he a d sta rt to e nte r the c ro sswa lk a t a n inte rse c tio n He lpful fo r o ld e r a nd d isa b le d pe d e stria ns who a re slo we r to sta rt c ro ssing
Ce nte r fo r Ac c e le ra ting Inno vatio n
Ce nte r fo r Ac c e le ra ting Inno vatio n
Ce nte r fo r Ac c e le ra ting Inno vatio n
Ce nte r fo r Ac c e le ra ting Inno vatio n
Ce nte r fo r Ac c e le ra ting Inno vatio n
Ce nte r fo r Ac c e le ra ting Inno vatio n
Ce nte r fo r Ac c e le ra ting Inno vatio n 17
Ce nte r fo r Ac c e le ra ting Inno vatio n 19
E xample
21
AADT = 14,000 Po ste d Spe e d = 40 mph; Ac tua l spe e ds = a ve ra g e 45 mph 2 L a ne s e a c h dire c tio n, with two -wa y c e nte r turn la ne
Poll: What c ounte r me asur e s may be good options for this e xample ?
Source: Virginia DOT
22
Ce nte r fo r Ac c e le ra ting Inno vatio n 23
T
FHWA Safety & Operations Engineer
MaineDOT Manager of Bicycle and Pedestrian Programs
MaineDOT -
Pedestrian Program Maine Department of Public Safety
Highway Safety
Maine DOL’s Division of the Blind and Visually Impaired Federal Highway Administration Maine’s Municipal Planning Organizations Bicycle Coalition of Maine Safe Routes to School Program Maine Developmental Disabilities Council City of Portland NL Partners American Automobile Association
Very complex issue Both driver and pedestrian actions contribute
Mark A. Cole, P.E.
Assistant Division Administrator – Highway Safety Traffic Engineering Division
September 2018
38
Virginia Pedestrian and Bicycle Safety Projects
Currently, over 90 bicycle and pedestrian HSIP Projects are underway. Valued at $75 Million
Pedestrians made up about 16% of Virginia highway fatalities in 2016
0.00 0.20 0.40 0.60 0.80 1.00 1.20 1.40 1.60 1.80 2.00 3,500 4,000 4,500 5,000 5,500 6,000 6,500 2010 2011 2012 2013 2014 2015 2016
Pedestrian Fatalitiy Rate per 100,000 Population Pedestrian Fatalities
U.S. Pedestrian Fatalities U.S. Pedestrian Fatality Rate
In 2017, 234 vulnerable road users died,
all traffic deaths Vulnerable Road User Deaths are Increasing
41
Crash Report
Fatal Injury
Fatal Injury
Residential/Commercial/Recreational Land Uses Rural/Industrial Land Uses
20% 80% Pedestrian Fatal Crashes 13% 87% Pedestrian Injury Crashes
Ped Crashes By Posted Speed Limit (mph)
Fatal Injury
134 70 9 155 1 10 52 239 33 6 76 5 24 671 103 6 193 21 17 107 10 25 12 2 11 0% 20% 40% 60% 80% 100% Two-way, Non-divided - 2 or 3 Lanes Two-way, Non-divided - 4+ Lanes Divided, No Control of Access - 2 … Divided, No Control of Access - 4+… Divided, Partial Or Full Control of … Divided, Partial Or Full Control of… One-way or Transition Private
Signalized Intersection Unsignalized Intersection Mid-Block Parking Lot Other
26% 74% Pedestrian Fatal Crashes 56% 44% Pedestrian Injury Crashes
48
Pedestrian Crash Heat Map Example
Goals
concerns and identify solutions to address them
to help ensure safe pedestrian travel
development and pedestrian safety
access and safety
Summarize and assess current VDOT policies:
pedestrian safety countermeasures not currently in roadway design manual
Service - per length or duration of pedestrian crossing
consider pedestrian mobility and safety
Step 2: Crash and Data Analysis
Crash Clusters
Priority Pedestrian Corridors
1-8 maps, additional inset zooms
Radford: Tyler Avenue (SR 177)
roadway.
Community: Radford VDOT District: 2 (Salem)
Priority Pedestrian Corridors: Criteria Considered
LAND USE FACTORS Pedestrian destinations (parks, trails, and schools) MPO urban area/land use data layer Bus stops and transit/passenger rail stations SPEED FACTORS Posted speed limits Operational speeds VISIBILITY FACTORS N/A: Lighting N/A: Pavement markings and crossing DESIGN/INFRASTRUCTURE FACTORS Signal density Intersection locations N/A: Sidewalk and path accommodations maintained by VDOT N/A: Crossing distance VOLUME/OTHER FACTORS Pedestrian crash data Vehicle traffic volumes Population and employment density (US Census) Vehicle ownership (US Census) Poverty levels (US Census) Prevalence of impaired (alcohol) citations
Top 1% Scored Segments
highways
Identify nearby segments within top 10% Aggregate segments into priority corridors
Priority Corridors Statewide
Top 1% of scored road segments Top 10% of scored road segments
I-64 VA 170
Williamson Road (US 11)
institutional land uses. AADT: ~15,000; Speed Limit: 35
land uses. Community: Roanoke VDOT District: 2 (Salem)
and NCHRP reports
Princeton, NJ
July 2018 update including RRFB Describes 6-step process for collecting and analyzing data to identify countermeasure
Pedestrian Hybrid Beacon (PHB)
A beacon to warn and control traffic at unsignalized marked crosswalks. Key design components include: overhead beacons, overhead “CROSSWALK STOP ON RED” signs, a crosswalk, and countdown pedestrian signal heads.
Countermeasures: Signage & Pavement Markings
Rectangular Rapid Flashing Beacon (RRFB)
A high-frequency blinking pedestrian warning sign used in tandem with a pedestrian cross sign. The beacon can be activated with pushbuttons or automated pedestrian detection. CRF: 47% Addresses: Visibility Crossing Awareness CRF: 18-37% Addresses: Visibility Crossing Awareness
A signal timing improvement where pedestrians are given an advance walk signal before motorists get a green signal. Makes pedestrians more visible to motorists and improve yielding A pedestrian signal head that begins a visible and possibly audible countdown at the beginning of the walk phase or clearance (i.e., DON’T WALK) interval to ensure safe crossing. CRF: 55-70% Addresses: Crossing Time CRF: Unknown Addresses: Visibility Yielding Behavior
Pedestrian Countdown Signal
Pedestrian Signals
Leading Pedestrian Intervals
View PSAP Report and Online Map
Coordinate review with VDOT staff / local agency
Develop and submit HSIP and/or SMART SCALE projects
VDOT is also moving policy recommendations forward
For more information: Mark Cole, P.E. VDOT Assistant State Traffic Engineer mark.cole@vdot.virginia.gov
Ce nte r fo r Ac c e le ra ting Inno vatio n
75
ST E P Wor kshops Road Safe ty Audits/ Asse ssme nts Sc an T
s Pe e r E xc hange Confe r e nc e Pr e se ntations ST E P Ac tion Plans
Arkansas – Tennessee Scan Tour Source: FHWA
Chat Pod
Ce nte r fo r Ac c e le ra ting Inno vatio n
Ce nte r fo r Ac c e le ra ting Inno vatio n
77
Up to $100,000 per STIC per year to standardize an innovation https://www.fhwa.dot.gov/innovation/stic/
Up to $1 million available per year to deploy an innovation not routinely used https://www.fhwa.dot.gov/innovation/grants/
Ce nte r fo r Ac c e le ra ting Inno vatio n
78
We e kly ne wsle tte r Bi-mo nthly ma g a zine
T
E ma il: https:/ / www.fhwa .do t.g o v/ inno va tio n/ T e xt: Se nd “F
HWA Innova tion” to 468311
Ce nte r fo r Ac c e le ra ting Inno vatio n
Que stions
79
Becky Crowe FHWA Office of Safety (804) 775-3381 Rebecca.Crowe@dot.gov Peter Eun FHWA Resource Center (360) 753-9551 Peter.Eun@dot.gov Wayne R. Emington P.E. Safety & Operations Engineer FHWA Maine Division (207)512.4919 wayne.emington@dot.gov Patrick D. Adams Regional Transportation Planner MaineDOT Planning Division (207) 624-3311 Patrick.Adams@maine.gov Mark A. Cole, PE Assistant Division Administrator- Traffic Engineering Division Virginia Department of Transportation (804) 786-4196 Mark.Cole@VDOT.Virginia.gov
Ce nte r fo r Ac c e le ra ting Inno vatio n
Photo Source: North Carolina Vision Zero, ncvisionzero.org
80