
SLIDE 1
( ) ( ) s i t y t d t where t = (x,y) denotes spatial - - PowerPoint PPT Presentation
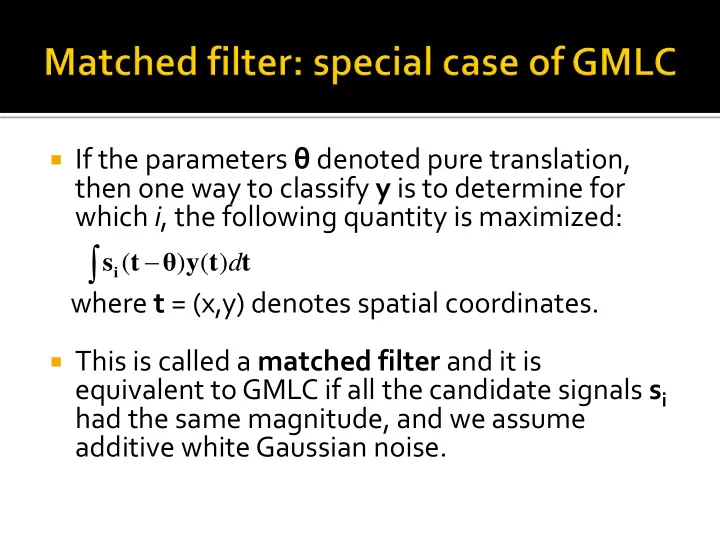
If the parameters denoted pure translation, then one way to classify y is to determine for which i , the following quantity is maximized: ( ) ( ) s i t y t d t where t = (x,y) denotes spatial coordinates. This is
n m n m
,
2
2 2 } ,..., 2 , 1 {
i i k
P k
2 2 } ,..., 2 , 1 {
i θ i i i i i k k
P k
This has an interesting name – the smashed filter (derived from the name “matched filter”), taking into account the compressive nature of the measurements.
2 2 1 2 2 2 1 2 2 1 2
k k
Image source: Davenport et al, “The smashed filter for compressive classification and target recognition”
Image source: Davenport et al, “The smashed filter for compressive classification and target recognition” Image size: 128 x 128 Compressive measurements taken by a Rice single pixel camera. Though the sensing matrix of the camera does not obey RIP since it contains values that are 0 or 1, it can be converted into a matrix with entries that are either -1 or +1. This is by taking two measurements of the same scene, where the second measurement is taken by flipping the 0 and 1 values in the first sensing matrix.
Pick the step-size adaptively so that you actually descend on the mutual coherence.
2 2
j j i i j i
n i i n i i
1 1
T T
T T T T T T T T T T T T
T T T T T T
2 F T T
Note: need not be
need not be identity.
2 F T T
T m)
2 1 n 2 1
, 2 , 2 1 , 1 2 2 n i n i i i F j i t j j t i i F T
Rank one matrix Ej We want a rank one matrix that approximates Ej as closely as possible in the Frobenius sense. The solution lies in SVD!
2 ˆ
F
A T t i i r i ii
1
Note: We are using the singular vectors corresponding to the r largest singular values. This property of the SVD is called the EckartYoung Theorem.
12
, 2 , 2 1 , 1 2 2 n i n i i i F j i t j j t i i F T
Rank one matrix Ej We want a rank one matrix that approximates Ej as closely as possible in the Frobenius sense. The solution lies in SVD.
t j t k k k kk T j
1 11
Assuming that S11 is the largest singular value
Ajit Rajwade
Ajit Rajwade
Imagine a line was drawn through the 2D image in a certain direction α, and you integrated the intensity values along that line. Now you repeat this for lines parallel to the
Each such summation produces a bin of the tomographic projection. The collection of bins form a 1D array which is called the tomographic projection or the Radon transform of the object in the direction α. https://en.wikipedia.org/wiki/Rado n_transform
The image is a simplification of a set of real biological tissues: example, an
set of tissues is bombarded with an X-Ray beam. The tumor has higher rate of absorption as compared to the surrounding tissue.
The degree of absorption of X-Rays at each point is measured by an X-Ray absorption detector. This detector produces a 1D signal whose amplitude/intensity is directly proportional to the extent of absorption. Any point in the signal = sum
across the path of a single ray in the X-Ray beam that spatially maps onto that point.
Xray-beam detector
Xray-beam detector
Sum-total of the two back-projections Given the 1D signal (called a projection signal), we try to reconstruct the original 2D image by smearing backwards along the direction of
back-projection. The 1D signal that was measured is duplicated along the columns of the image to be estimated (see the directions marked in yellow).
Even with many (32) back-projections, there is a blur artifact in the
effect”.
I0 X-Ray Image X Y Z
L L
I0 = intensity of the X-ray beam from the source I = intensity of the X-ray beam as measured by the detector, given by Beer’s law
Given a direction ϴ, the source and detector pair move along that direction in fixed steps (i.e. variation in ρ). The distance between source and detector is constant. At each step, the source sends out an X-Ray beam onto the subject, and the projection value is recorded on the detector and stored in a computer. This process is repeated for several values of ϴ. In the end, we record a single 2D slice. Now, the subject is moved in a direction perpendicular to the plane of the source-detector pair, and another 2D slice is recorded. This is called 1st generation CT. Source of image: Book by Gonzalez, 3rd edition
The direction of projection is denoted L, and dL is an infinitesimally small element along
ρ θ
dxdy y x y x f g f R ) sin cos ( ) , ( ) , ( ) (
1 1
) sin cos ( ) , ( ) , ( ) (
M x N y
y x y x f g f R
One single projection vector is obtained with a fixed value
Dirac delta function Kronecker delta function
2 2 2
2 2
2 ) , ( ) , ( ) ( ) , ( ) sin cos ( ) , ( ) , ( ) (
2 2 2 2 2 2 2 2
r A Ady dy y f dy y f dxdy x y x f dxdy y x y x f g f R
r r r r
Sinogram (a radon transform plotted as an image in a (ρ,ϴ) grid. https://en.wikipedia.org/wiki/Radon_transform
dxdy y x y x f g f R ) sin cos ( ) , ( ) , ( ) ( ) , sin cos ( ) , ( ) , ( ˆ
k k k k
y x g g y x f
k
1
) , ( ˆ ) , ( ˆ ) , ( ˆ ) , sin cos ( ) , ( ˆ y x f y x f d y x f d y x g y x f
K k
k
Radon transform:
sampling several different angles Fix the angle ϴk and for all x and y, compute the value
hat(f)ϴk(x,y), which is the image obtained when you back-project along angle ϴk. The back-projection operator is NOT the same as the inverse of the Radon transform! So this does not yield back the true signal f(x,y), but the signal f(x,y) blurred with the kernel (x2+y2)-0.5. More on this a few slides down, when we do filtered back-projection.
The blur is a painful consequence of (1) discretization of the angle ϴ, and (2) the inherent blurring with the kernel (x2+y2)-0.5. These images are reconstructed at 0.5 degree changes in ϴ. How do we get rid of this blur? Wait for a few slides!
dxdy y x y x f g f R ) sin cos ( ) , ( ) , ( ) (
d j g G 2 exp ) , ( ) , (
G(μ, ϴ) is the Fourier transform of the projection of f(x,y) along some direction ϴ.
dxdyd j y x y x f 2 exp ) sin cos ( ) , (
dxdy
y x j y x f dxdy d j y x y x f
) sin cos ( 2 exp ) , ( 2 exp ) sin cos ( ) , (
sin , cos define we where ) ( 2 exp ) , ( ) sin cos ( 2 exp ) , ( ) , (
v u dxdy yv xu j y x f dxdy y x j y x f G
) sin , cos ( ) , ( ) , (
sin , cos
F v u F G
v u
The RHS of this equation is a slice of the 2D Fourier transform of f(x,y), i.e. F(u,v), along the angle ϴ in the frequency plane, and passing through the origin This equation above is called the Projection Slice Theorem or the Fourier Slice Theorem. It states that the Fourier transform of a projection of the 2D object along some direction ϴ (i.e. G(μ, ϴ)) is equal to a slice of the 2D Fourier transform of the object along the same direction ϴ (in the frequency plane), passing through the origin.
The Projection Slice Theorem or the Fourier Slice Theorem states that the following two are equivalent: (1) Project a 2D object along a certain direction d. Take its 1D Fourier Transform called as F1. (2) Compute the 2D Fourier transform of the same object. Take a slice of this Fourier transform along a direction parallel to d (but in the frequency plane). Call this slice as F2. Now F1 = F2. Source of image: https://en.wikipedia.org/wiki/Projection- slice_theorem