Russian Academy of Sciences A.M. Obukhov Institute of atmospheric - - PowerPoint PPT Presentation

russian academy of sciences a m obukhov institute of
SMART_READER_LITE
LIVE PREVIEW

Russian Academy of Sciences A.M. Obukhov Institute of atmospheric - - PowerPoint PPT Presentation

Russian Academy of Sciences A.M. Obukhov Institute of atmospheric physics Laboratory of mathematical ecology Nikolay N. Zavalishin BIOTIC TURNOVER IN FOREST AND PEATLAND ECOSYSTEMS OF BOREAL AND FOREST-STEPPE ZONES IN THE EUROPEAN TERRITORY OF


slide-1
SLIDE 1

Nikolay N. Zavalishin BIOTIC TURNOVER IN FOREST AND PEATLAND ECOSYSTEMS OF BOREAL AND FOREST-STEPPE ZONES IN THE EUROPEAN TERRITORY OF RUSSIA AND WESTERN-SIBERIA UNDER CLIMATE CHANGE

e-mail: nickolos@ifaran.ru

Russian Academy of Sciences A.M. Obukhov Institute of atmospheric physics Laboratory of mathematical ecology

Supported by the RFBR project 10-05-00265a and the Program 12 of the RAS Earth Sciences Department

slide-2
SLIDE 2

Problems and uncertainties in modeling biogeochemical cycles

  • incompleteness of measurements on important reservoirs and flows (e.g., microorganisms

and decay rates);

  • uncertainty in information on flow dependences in different conditions for many types of

peatlands;

  • “upscaling” problem: algorithms are needed for spreading geographically local modelling

results on large territories with estimating their correctness;

  • how to account for uncertainty in storage-flow values ?
  • aggregation of complicated schemes of biological turnover in peatland ecosystems to

simplest variants;

  • design and calibration for dynamic models of carbon and combined carbon-nitrogen

cycle in some types of forest and peatland ecosystems of boreal and forest-steppe zones on the basis of aggregated schemes;

  • calculation of stability boundaries for steady states of single and combined cycles, study
  • f their evolution under input flows and parameter variations initiated by climate change;
  • model estimating changes in carbon and nitrogen functioning which can be considered as

a reaction of peatland ecosystems to external climatic perturbations.

Main goals in mathematical modelling of biological turnover in ecosystems on an annual time scale

slide-3
SLIDE 3

Due to structural complexity and lack of knowledge on functioning mechanisms, mathematical modeling of main ecosystem biogeochemical cycles is necessary for forecasting reactions and dynamic behavior of those ecosystems to external perturbations. Peatlands and forests of middle and southern taiga take an important part in regulating biogeochemical cycles of carbon, nitrogen, water and mineral elements both at regional and at the global levels. Carrying out an active matter exchange with the environment they can be sources or stocks for green-house gases under the climate change and human economic and resource-extraction activities.

Biogeochemical cycles in ecosystems of boreal and forest-steppe zones

Model classes for biotic turnover Detailed simulation models Qualitative “minimal” models

slide-4
SLIDE 4

?

Mesotrophic peatland ecosystem in the southern taiga, European part of Russia (Novgorod region): carbon, nitrogen and mineral element biotic cycles (Bazilevich and Tishkov, 1982, 1986; Alexandrov et al., 1994)

Local low-parametric dynamic model of coupled carbon-nitrogen cycles with climatic parameterization and steady states corresponding to the bog ecosystem types

Biogeochemical cycles in a peatland ecosystems of middle and southern taiga

slide-5
SLIDE 5

Biogeochemical cycles in a spruce forest in southern taiga of the European territory of Russia

Biotic turnover in the ecosystem of the spruce forest, Central Forest Reserve (Tver Region): carbon, nitrogen and mineral element cycles (Bazilevich and Tishkov, 1982; Glazov, 2004)

?

Local low-parametric dynamic model of coupled carbon- nitrogen cycles with climatic parameterization and steady states corresponding to spruce forest types

Photo is from (Bazilevich and Titlyanova, 2008)

slide-6
SLIDE 6

?

Oak forest ecosystem in the forest-steppe zone, European part of Russia : carbon, nitrogen and mineral element biotic cycles (Bazilevich et al., 1986)

Local low-parametric dynamic model of coupled carbon-nitrogen cycles with climatic parameterization and current steady state

Biogeochemical cycles in an oak-forest in forest-steppe ecosystems

slide-7
SLIDE 7

Universality of biotic turnover in terrestrial ecosystems and aggregation principles

G Ph+Z Pr D+D’ R

V+L+{Slh} Mo+F+Sph

Sln

Aggregation principles: 1) division of living and dead organic matter;

2) division of above- and underground living organic matter; 3) consumers (C=Ph+Z) and destructors (Ds=Mo+F+Sph) are aggregated into separate units independently on where they live. Reservoirs: G – green phytomass, Pr – perennial phytomass, R – living roots, D+D’- dead standing phytomass, V+L+{Slh} – dead roots + litter + {humus}, Ph+Z – phyto- and zoophages, Mo+F+Sph – microorganisms+fungi+saprophages, Sln – soil reserve nutrients. Carbon and nitrogen flows in an ecosystem: photosynthesis, respiration, denitrification and nitrogen fixation consumption, litterfall, excretion accumulation in real increment, import and export, abiotic

  • xidation,

translocation

slide-8
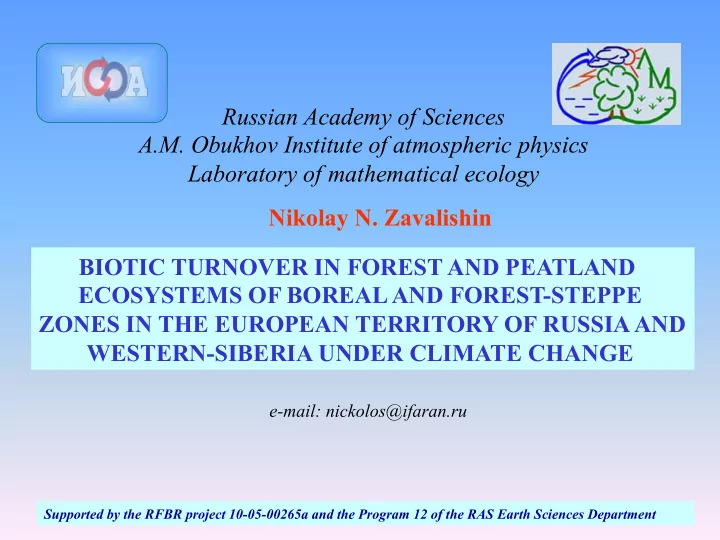
SLIDE 8

Minimal aggregated compartment schemes of carbon and nitrogen cycles in forest and peatland ecosystems

C1, N1 C2, N2 C3, N3

y1

C

f12

C

f13

C

q2

C

y2

C

f32

C

y31

C

q3

C

f23

C

q1

C

y1

N

q2

N

f12

N

f13

N

f31

N

f32

N

q3

N

f23

N

y32

C y33 C

y31

N

y32

N

y2

N

Storages : C1, N1 - phytomass; C2, N2 – phytophages and destructors (animals, fungi, bacteria); C3, N3 – dead organic matter of litter and root-based peat layer Flows : q1

C– carbon assimilation from the atmosphere, q1 N, q2 N–

nitrogen input from adjacent ecosystems with atmospheric nitrogen fixation by microorganisms, q2

C– dead organic matter

input from adjacent ecosystems, y11

C – autotrophic respiration,

y12

C, y12 N – export and run-off, y13 C, y13 N – consumption by

phytophages, y21

C, y21 N – decay of dead organic matter by

destructors with denitrification, y22

C, y22 N – export and run-off,

y23

C, y23 N – peat formation, y24 C – abiotic oxidation of dead

  • rganic matter, f21

N – nitrogen uptake by vegetation from

available soil compounds, f12

C, f12 N – litterfall.

C1, N1 C2, N2

y12

C

f12

C

y13

C

y21

C

q2

C

q1

C

y12

N

q1

N

f12

N

f21

N

q2

N

y22

C

y23

C

y21

N

y22

N

y13

N

y11

C

y24

C

y23

N

Storage : C1, N1 – living organic matter; C2, N2 – dead organic matter possible aggregation

slide-9
SLIDE 9

Data availability of biotic turnover in peatland and forest ecosystems of the European territory of Russia and Western Siberia

Ecosystem Carbon cycle Nitrogen cycle References European territory of Russia Oligo- and mesotrophic peatlands, pine forest in middle taiga a number of components a number of components Kozlovskaya et al., 1978 Mesotrophic pine-shrub-sphagnum peatland in southern taiga все компоненты все компоненты Bazilevich and Tishkov, 1982, 1986; Oligotrophic, eutrophic grass, eutrophic forest peatlandsin southern taiga a number of components not available Tishkov, 1986 Spruce forest with bilberry in southern taiga a number of components a number of components Tishkov, 1979; Bazilevich et al., 1986; Glazov, 2004 Spruce forests with green mosses and grasses in southern taiga a number of components not available Glazov, 2004 Pine forest in southern taiga a number of components a number of components Bazilevich and Titlyanova, 2008 Oak forest in forest-steppe zone a number of components a number of components Bazilevich et al., 1986 Western Siberia Main types of oligotrophic petlands in southern taiga (ryams, fen) a number of components not available Golovatskaya, Dyukarev, 2009; Valutskii and Khramov, 1977 Eutrophic fen in southern taiga a number of components not available Golovatskaya, 2009 Mesotrophic fen in southern taiga a number of components a number of components Bazilevich and Titlyanova, 2008 Oligotrophic peatlands in middle taiga a number of components a number of components Naumov et al., 2007; Kosykh et al., 2010; Makhatkov et al., 2007 Mesotrophic fen in middle taiga a number of components a number of components Kosykh et al., 2010 Pine forest in southern taiga a number of components not available Vedrova, 1997 Grass peatland in forest-steppe zone a number of components a number of components Titlyanova, 1979; Naumov et al., 2009

slide-10
SLIDE 10

fki ( xk , xi )

x k ( t ) x i ( t ) x 1 ( t )

yk ( xk ) qk ( t ) qi ( t )

yi ( xi ) q1( t )

y1( x1 )

fik (xi , xk ) xk=3.5

xi=70 x1= 180

yk = 0.8 qk = 0.5

f k i = 15

q i = 8

yi = 3

q1 = 30 y1 = 10

f k i = 8.5

?

General problem of a dynamic model design by a given «storage-flow» diagram

a set of compartment schemes for time moments t0, t1,…, collected from field studies dynamic model for storages in reservoires

∑ − + − =

≠ = n i k k ik ki i i i

f f y q dt dx

, 1

) (

The main problem: how to make dynamic model from measured static schemes?

Two main approaches to the dynamic model design “Global” “Local”

slide-11
SLIDE 11

1) any number of static schemes for various time moments can be a source for a dynamic model; 2) yi = mixi – output flows are linear; 3) qi = qi(xi), fki = fki (xk, xi); fik = fik(xi, xk) – flow functions are selected using biological information and expert knowledge, e.g., - donor type,

  • recipient type, - Lotka-

Volterra type, saturation types:

,

i ki i k ki

x L x x K + ,

k ki i k ki

x L x x K +

) )( (

i ki k ki i k ki

x N x L x x K + +

i ijx

α

j ijx

β

j i ij

x x γ

fki ( xk , xi )

x k ( t ) x i ( t ) x 1 ( t )

yk ( xk ) qk ( t ) qi ( t )

yi ( xi ) q1( t )

y1( x1 )

fik (xi , xk )

Two approaches to a dynamic model design by given «storage-flow» diagrams Mass-balance equations:

“Global” approach “Local” method

∑ − + − =

≠ = n i k k ik ki i i i

f f y q dt dx

, 1

) (

1) q* + f* = y* - at least one of the given diagrams is a dynamic equilibrium; 2) yi = mixi – output flows are linear; 3) fki = fki (xk, xi); fik = fik(xi, xk) – flow functions are represented asymptotically near the given equilibrium, :

... ~ ~ ~ ~ ~ ~ ) ~ (

2 2

+ + + + + + = +

∗ ∗ j i i i j i ij j ij i ij ij ij

x x x x x x f x x f η ξ γ β α

− =

i i i

x x x ~

∑ ∑ ∑ ∑

≠ ≠ ≠ ≠

+ + + − + + − + − =

i j i j j j j j i ij ji i j ij ji j i j ij ji i i

x x x x x dt x d ... ) ( ~ ~ ~ ) ( ) ( ~ ~ ~

2

η ξ γ γ β α α β

slide-12
SLIDE 12

Biomass and Net Primary Production in the biological turnover

slide-13
SLIDE 13

Oligotrophic pine-shrub-sphagnum Oligotrophic low pine-shrub-sphagnum

Minimal static schemes of carbon cycle in peatland ecosystems of southern taiga in Western Siberia

C1 = 2985.9 C2 C3 = 2430.26

f12

C = 23

f13

C=111

q2

C = 20

y2

C=140.1

f32

C-f23 C+y2 C = 236.2

y31

C=8

q3

C = 0

f23

C

y32

C = 21

NPP=q1

C-y11 C=350.1

f23

C - f32 C = 106.5

16

C1 = 1204.8 C2 C3 = 1826.6

f12

C=5.7

f13

C=134.7

q2

C=20

y2

C=121.6

f32

C-f23 C+y2 C = 156.3

y31

C=8

q3

C=0

f23

C

y32

C = 112

NPP=q1

C-y11 C=150.4

f23

C - f32 C = 14.7

10

Storages - gC/m2, flows - gC/m2·year.

Oligotrophic sedge-sphagnum fen

C1 = 465.8 C2 C3 = 1534.4

f12

C=27.3

f13

C=242.1

q2

C=20

y2

C=45.7

f32

C-f23 C-q2 C+y2 C = 157.8

y31

C=8

q3

C=0

f23

C

y32

C = 102

NPP=q1

C-y11 C=269.4

f23

C - f32 C =132.1

C1 = 1068 C2 C3 = 2157.5

f12

C=8.4

f13

C=184.2

q2

C=8

y2

C43.6

f32

C-f23 C+y2 C = 130.8

y31

C=10

q3

C=15

f23

C

y32

C = 102

NPP=q1

C-y11 C=192.6

f32

C - f23 C =87.2

Eutrophic sedge-sphagnum fen

Data from (Golovatskaya, Dyukarev, 2009; Golovatskaya, 2010; Valutskii, Khramov, 1977).

slide-14
SLIDE 14

Carbon and nitrogen cycles in peatland ecosystems of middle taiga in Western Siberia

Oligotrophic pine-shrub- sphagnum peatland (ryam) Oligotrophic ridge Oligotrophic hollow

Data from (Kosykh, Mironycheva-Tokareva, Parshina, 2010; Makhatkov, Kosykh, Romantsev, 2007; Makhatkov, Kosykh, 2010).

C1=1242.4 N1=15.07 C2 = 4348.1 N2 = 27.4

y12

C = 20.9

f12

C=430.2

y21

C = 124.2

q2

C = 1.4

NPP=q1

C-y11 C = 457.5

y12

N = 0.5

f12

N= 5.74 f21 N = 6.24

q2

N=0.3

y22

C = 307

y21

N=1.65

y22

N = 4.39

13

C1=1014.2 N1=14.01 C2 = 4330.5 N2 = 27.02

y12

C = 17.8

f12

C=348.2

y21

C = 100.6

q2

C =1.8

NPP=q1

C-y11 C = 376

y12

N = 0.4

f12

N= 5.51 f21 N = 5.91

q2

N=0.4

y22

C =

y21

N=2.14

y22

N = 2.5

10

C1=789.8 N1=7.1 C2 = 4095.2 N2 = 21.5

y12

C = 5

f12

C=320.1

y21

C = 50.2

q2

C = 2.5

NPP=q1

C-y11 C = 325.1

y12

N = 1.5

f12

N= 1.3 f21 N = 2.9

q2

N=4.1

y22

C = 242

y21

N=0.74

y22

N = 1.8

Storages - gC/m2, gN/m2, flows - gC/m2·year, gN/m2year.

C1=907.4 N1=12.8 C2 = 3256.6 N2 = 17.6

y12

C = 30

f12

C=529

y21

C = 149.2

q2

C = 5

NPP=q1

C-y11 C = 562.7

y12

N = 2.4

f12

N= 6.3 f21 N = 8.7

q2

N

y22

C = 285

y21

N=4.0

y22

N = 0.3

3.7

Mesotrophic sedge-sphagnum fen

slide-15
SLIDE 15

Possible evolution of peatland turnover under atmospheric CO2 doubling climate change

Mesotrophic Zone Raised

West-Siberian middle taiga West-Siberian southern taiga West-Siberian forest-steppe

1 – oligotrophic bog – “ryam”; 2 – mesotrophic mire; 3 – oligotrophic fen; 4 – mesotrophic fen; 5 – sphagnum pinery; 6 – eutrophic mire

slide-16
SLIDE 16

Other intercompartment flows:

  • nitrogen uptake from soil by plants:
  • carbon assimilation from the atmosphere by vegetation:
  • consumption of living phytomass by phytophages:

y12

C=α12 CC1 , y12 N=α12 NN1;

  • peat formation process: y23

C=m23 CC2 , y23 N=m23 NN2 ;

  • export to other systems and run-off: y22

C=m22 CC2 , y23 N=m22 NN2 .

1 2 2 2 21 21

C C N f

N N

γ =

Mathematical form for coupled N-C потоков (Alexandrov et al., 1994): 1) Litterfall :

  • carbon flow: , nitrogen flow:

2) Decomposition of dead organic matter:

  • carbon flow: , - nitrogen flow:

1 2 1 12 12

N C f

C C

α =

1 12 12

C f

N N

α =

2 2 2 2 21

C N d y

N N =

2 2 21

N d y

C C =

Modelling a combined carbon-nitrogen turnover in forest and peatland ecosystems: biological mechanisms

Carbon and nitrogen interaction is provided by two mechanisms (Logofet, Alexandrov, 1984): 1) intensity of litterfall (f12

C) is proportional to the C1/N1 ratio in the living phytomass that reflects

nitrogen starvation of plants; 2) decay rate for dead organic matter decreases with the increase of C3/N3 ratio.

1 01 1 01 1 1 01 1

N P C L N C K q

C C C

+ + =

C1, N1 C2, N2

y12

C

f12

C

y13

C

y21

C

q2

C

q1

C

y12

N

q1

N

f12

N

f21

N

q2

N

y22

C

y23

C

y21

N

y22

N

y13

N

y11

C

y24

C

y23

N

slide-17
SLIDE 17

C1 = 15461.1, N1=100 C2=39.15, N2=0.5 C3=11001, N3=488

y1

C=904.59

f12

C=14.76

f13

C=580.55

q2

C=0

y2

C=558.325

f32

C= 542.55

y3

C=143.45

q3

C=8.55

f23

C=15.84

q1

C=1634.9

y1

N=4.1

q1

N=0

f12

N=0.6

f13

N= 17.2

f31

N= 13

q3

N=0.4

y3

N=7.6

q2

N=0.2

f23

N=9.23

0.45 135 f32

N=8.7

Minimal schemes of carbon and nitrogen cycles in peatland and spruce forest ecosystems of southern taiga in the European territory of Russia

Mesotrophic peatland Spruce forest with bilberry

C1 = 3820.6, N1=25.3 C2=18.06, N2=0.1 C3=5036.3, N3=78.9

y1

C=269.12

f12

C=17.325

f13

C=154.45

q2

C=10

y2

C=147.49

f32

C= 283.83

y3

C=65.39

q3

C=16.08

f23

C=178.69

q1

C=444.4

y1

N=0.083

q1

N=0

f12

N=0.7

f13

N= 6.15

f31

N= 2.14

f23

N=0.13

q3

N=0.825

y3

N=1.58

q2

N=0.41

f32

N=0.7

y2

N=0.3

0.032 3.51

Forest type NPP, gC/ m2year C1, gC/ m2 N1, gN/ m2 C3, gC/ m2 Spruce forest with bilberry

562 15461 100 11001

Spruce forest with mosses

377 10860 55 8845

Spruce forest with grass

612 15640

  • 9548

Peatland type NPP, gC/ m2year C1, gC/ m2 N1, gN/ m2 C3, gC/ m2 Mesotrophic

175 3821 25 5036

Oligotrophic

99 2305 15 3785

Eutrophic grass

45 175

  • 405

Eutrophic forest

232 3956 26 1516

Pinery

550 23000 68 5500

Storages - gC/m2, gN/m2, flows - gC/m2·year, gN/m2year.

slide-18
SLIDE 18

Mass-balance equations:

i = 1,..,n

∑ − + − =

≠ = n i k k C ik C ki C i C i i

f f y q dt dC

, 1

) ( ∑ − + − =

≠ = n i k k N ik N ki N i N i i

f f y q dt dN

, 1

) (

Dynamic equations of a three-component model: (1) ( )

⎪ ⎪ ⎪ ⎪ ⎪ ⎪ ⎪ ⎩ ⎪ ⎪ ⎪ ⎪ ⎪ ⎪ ⎪ ⎨ ⎧ − − + + − = − + + − = + + − − = + − + − + = + − − − = ⎟ ⎟ ⎠ ⎞ ⎜ ⎜ ⎝ ⎛ − − − + + =

3 2 3 2 32 1 3 2 3 31 2 23 1 13 3 3 3 3 3 2 32 2 23 1 2 1 13 3 3 3 3 2 3 2 3 32 1 2 12 2 23 2 2 2 2 2 3 32 23 1 12 2 2 2 2 2 3 2 3 1 31 1 13 1 2 12 1 1 1 1 1 13 2 12 1 1 01 1 01 1 01 1 1

/ / / / / / C N C C C N N C N m q dt dN N C C N C C m q dt dC C C N N C N N m C K dt dN N C m C C K dt dC C N C C N C N m dt dN N C C m N P C L N K C dt dC

N N N N N N C C C C C N N N N N C C C C C N N N N C C C C C

γ γ α α γ α α γ γ α γ α γ γ α γ α γ

Dynamic equations of a two-component model: (2) ⎪

⎪ ⎪ ⎪ ⎪ ⎩ ⎪ ⎪ ⎪ ⎪ ⎪ ⎨ ⎧ − − + − = + − − = + − − − = ⎟ ⎟ ⎠ ⎞ ⎜ ⎜ ⎝ ⎛ − − − + + =

2 2 2 2 1 2 2 2 21 1 21 2 2 2 2 1 2 1 12 2 2 2 2 2 2 2 2 2 1 21 1 12 1 13 1 1 1 1 1 12 13 1 1 01 1 01 1 01 1 1

/ / / / C N d C C N C N m q dt dN N C N d C m q dt dC C N C C N N m dt dN N C m N P C L N K C dt dC

N N N N N C C C C N N N N C C C C C

γ α α γ α α α α

Dynamic equations of the combined carbon and nitrogen turnover in forest and peatland ecosystems (“global” method)

C1, N1 C2, N2

y12

C

f12

C

y13

C

y21

C

q2

C

q1

C

y12

N

q1

N

f12

N

f21

N

q2

N

y22

C

y23

C

y21

N

y22

N

y13

N

y11

C

y24

C

y23

N

C1, N1 C2, N2 C3, N3

y1

C

f12

C

f13

C

q2

C

y2

C

f32

C

y31

C

q3

C

f23

C

q1

C

y1

N

q2

N

f12

N

f13

N

f31

N

f32

N

q3

N

f23

N

y32

C y33 C

y31

N

y32

N

y2

N

slide-19
SLIDE 19

Parameter calibration for dynamic models of coupled carbon-nitrogen cycle in peatland ecosystems and climate-induced values

For example, from (2) for oligotrophic (index o) and mesotrophic (index m) peatlands coefficients of the flow q1

C can be calculated easily:

, ) ( ) (

1 1 1 1 1 1 1 1 1 1 1 1 1 1 1 01

  • m

m

  • m

m m m m m

  • m
  • m

C

N C N C C m NPP C m NPP C m NPP N N C m NPP C L + − + ⎥ ⎦ ⎤ ⎢ ⎣ ⎡ − − + =

m m m C C C

N C C L q K

1 1 1 01 1 01

) ( + =

Temperature dependent model parameters with change according to scenarios of global climate model MPIM-ECHAM5 of СО2 concentration doubling in the atmosphere: q1

С = q1 С(C1)- carbon assimilation by plants increases under atmospheric CO2 content; m3 С =m3 С(T)– peat

formation intensity, m2

С =m2 С(T,H) – heterotrophic respiration intensity and γ32 С =γ32 С(T,H) – intensity of

decay for dead organic matter depend on the annual air temperature and precipitation sum in a polynomial form. Coefficients of flow functions depending on the single storage are calculated from the given scheme:

;

* *

x y m

i i i =

;

* *

x f

i ki ki =

β

;

* *

x f

k ki ki =

α

;

* * *

x x f

k i ki ki =

γ

The main idea for calibrating coefficients K01

С and L01 С is to use the net primary productivity

(NPP) of living phytomass for two ecosystems, adjacent in state: (2) ⇒ − + =

1 1 1 01 1 1 01

C m C L N C K NPP

C C C

⎪ ⎩ ⎪ ⎨ ⎧ = + + = + +

  • C

e C

  • m

m C m C m m m

N C K C L C m NPP N C K C L C m NPP

1 1 01 1 01 1 1 1 1 01 1 01 1 1

) )( ( ) )( (

  • for basic peatland
  • for calculated peatland
slide-20
SLIDE 20

Stability boundaries for dynamic regimes in two-component models of coupled carbon-nitrogen cycle

Atmospheric carbon assimilation intensity rate, gC/m2·year Specific intensity of peat formation and run-off, 1/year

Stability boundaries of stationary dynamic regime of the biological turnover: 1 – oligotrophic bog – “ryam”; 2 – mesotrophic mire; 3 – mesotrophic fen; 4 – oligotrophic fen; 5 – sphagnum pinery; 6 – eutrophic mire

slide-21
SLIDE 21

Conclusions

1) method of dynamic compartment model design by static “storage-flow” schemes helps in constructing coupled models of carbon-nitrogen cycle functioning in peatland ecosystems based on two most important connections: litterfall dependence on C/N relation in living organic matter and increase of decomposition rate under C/N decrease in dead organic matter; 3) under the doubling of the atmospheric CO2 content, accompanied by annual temperature increase, oligotrophic peatlands (ryams) of the middle and southern taiga in Western Siberia can be transformed into sphagnum pineries, if precipitation would decrease, and into fens in the opposite case; 2) including nitrogen cycle in the model of ecosystem functioning allows to reflect biologically possible states of bog and forest more adequately than it was for single carbon cycle models, although not all steady states appear under the particular set of coefficients; 4) mesotrophic peatlands under this climate scenario can be transformed into

  • ligotrophic ones, or sphagnum pineries.

Thank you for attention !

slide-22
SLIDE 22
  • ligotrophic

mesotrophic eutrophic States of peatlands to be accounted in models

by nutrient regime by water regime

forest forest-fen fen Элементы классификации лесов в моделях

ельники сосняки березняки кисличники зеленомошники разнотравные

Classification elements of ecosystems in boreal and forest-steppe zones

slide-23
SLIDE 23

Мезотрофная осоково- кустарничково-сфагновая топь

Запасы - гN/м2, гC/м2, потоки - гN/м2·год, гC/м2·год.

Минимальные схемы углеродного и азотного циклов в болотных экосистемах южной тайги Западной Сибири

Данные мезотрофного из (Базилевич, Титлянова, 2008).

Тип болота NPP, гC/ м2год C1, гC/ м2 N1, гN/м2 C3, гC/ м2 Мезотрофное

589.5 940.5 13.3 1043

Олиготрофная топь

269.4 465.8

  • 1534.4

Низкий рям

313.4 1204.8

  • 1826.6

C1=940.5 N1=13.3 C2 = 1043.1 N2 = 18.5

y12

C = 28.9

f12

C=560.6

y21

C = 360

q2

C = 6.4

NPP=q1

C-y11 C = 589.5

y12

N = 4.7

f12

N= 5.3 f21 N = 9

q2

N=1.5

y22

C = 170

y21

N=2.5

y22

N = 0.3

Сосняк бруснично- лишайниковый

C1 C2 y12

C

f12

C

y13

C

y21

C

q2

C

NPP=q1

C-y11 C

y22

C

y23

C

slide-24
SLIDE 24

Carbon and nitrogen cycles in peatland and forest ecosystems of forest-steppe zone in European Russia and Western Siberia

Reservoirs - gN/m2, g/m2 of dry organic matter, Flows - gN/m2·year, g/m2·year of dry organic matter. Дубрава осоково- снытевая (Базилевич и др., 1986; Базилевич и Титлянова, 2008)

C1, N1 C2, N2

y12

C

f12

C

y13

C

y21

C

q2

C

q1

C

y12

N

q1

N

f12

N

f21

N

q2

N

y22

C

y23

C

y21

N

y22

N

y13

N

y11

C

y24

C

y23

N

C1, N1 C2, N2

y12

C

f12

C

y13

C

y21

C

q2

C

q1

C

y12

N

q1

N

f12

N

f21

N

q2

N

y22

C

y23

C

y21

N

y22

N

y13

N

y11

C

y24

C

y23

N

Травяное болото в Западной Сибири (Титлянова, 1979) Данные для .