Rumor Spreading They tell the rumor only to their nearest - - PDF document

rumor spreading
SMART_READER_LITE
LIVE PREVIEW

Rumor Spreading They tell the rumor only to their nearest - - PDF document

Cultural and Social Interactions Rumor Spreading and Voting Rumor models Voting model Culture and Social Cultural Exchange Interactions The more alike we are, the more alike we become Social status and role models


slide-1
SLIDE 1

1

Culture and Social Interactions

Christian Jacob

  • Dept. of Computer Science
  • Dept. of Biochemistry & Molecular Biology

University of Calgary

2

Cultural and Social Interactions

  • Rumor Spreading and Voting

– Rumor models – Voting model

  • Cultural Exchange

– The more alike we are, the more alike we become – Social status and role models

  • Grouping and Conforming

– Forming neighbourhoods – Segregation

  • Social Networking

– Nonlocal movement

3

Rumor Spreading and Voting

4

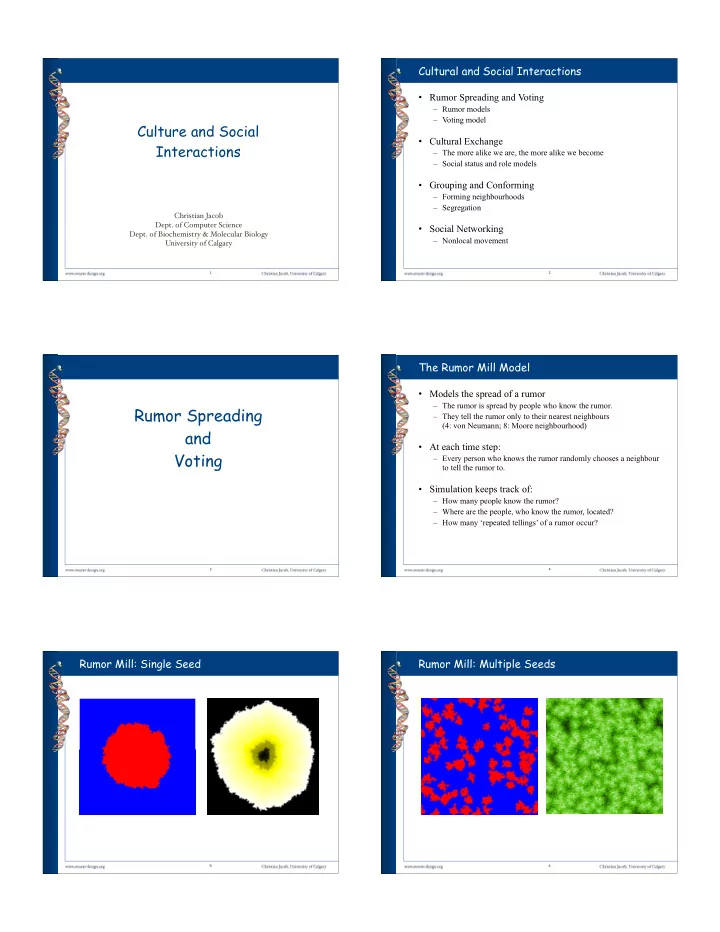
The Rumor Mill Model

  • Models the spread of a rumor

– The rumor is spread by people who know the rumor. – They tell the rumor only to their nearest neighbours (4: von Neumann; 8: Moore neighbourhood)

  • At each time step:

– Every person who knows the rumor randomly chooses a neighbour to tell the rumor to.

  • Simulation keeps track of:

– How many people know the rumor? – Where are the people, who know the rumor, located? – How many ‘repeated tellings’ of a rumor occur?

5

Rumor Mill: Single Seed

6

Rumor Mill: Multiple Seeds

slide-2
SLIDE 2

7

Voting

  • Each patch takes a “vote” of its eight surrounding

neighbours and itself.

  • The patch changes its own vote according to the outcome:

– Traditional Voting Rule: The central patch changes its colour to match the majority vote. – Near Losses Awarded to Loser:

  • If five patches vote for white (and, consequently, four patches vote for

black), the central patch becomes black.

  • If five patches vote for black, the central patch becomes white.
  • All other possible voting combinations are awarded traditionally.

8

Voting: Tradition vs. Near Losses for Loser

9

Cultural Exchange

The more alike we are, the more alike we become

10

Axelrod’s Transmission of Culture Model

  • In 1997 Robert Axelrod proposed the following model for

the transmission of culture:

– On a square lattice, each site is occupied by an agent (homogeneous village). – Agents interact with their four nearest neighbours. – An agent is characterized by having attributes (features), with an integer value (a trait) between 0 and 10.

  • At each time step:

– An agent is randomly chosen (active agent). – The active agent randomly selects an agent from its nearest neighbour site. – The active agent interacts with the selected agent.

11

Axelrod’s Transmission of Culture Model (2)

  • Cultural Interaction Rules:

– When an agent interacts with another agent, a comparison is made between their traits of corresponding features.

  • If their traits are the same (e.g., {5, 9, 1, 3, 2} and {5, 9, 1, 3, 2}),

nothing happens.

  • If any of the traits differ, a cultural interaction occurs:

– The probability of this interaction is equal to the fraction of features that share the same trait, – ... that is, to their degree of cultural similarity. – Example: {4, 8, 1, 2, 5} and {3, 2, 1, 7, 5} have a 40% probability of interacting culturally, as features 3 and 5 have the same traits (2/5). – Interaction: One of the features of the active agent A that differs from the corresponding feature of the selected agent B is set to the feature trait of B. Example: A: {4, 2, 1, 2, 5}, B: {3, 2, 1, 7, 5}

12

Extensions of Axelrod’s Model

  • Mobility:

– Axelrod: no movement, sites are static (‘homogeneous villages’) – Extension: Some lattice sites are empty and some occupied by agents, that can walk around on the grid.

  • Bilateral Cultural Exchange:

– Axelrod: pairwise interaction between agents is one-way or unilateral; only the active agent’s trait is changed. – Extension: Bilateral interactions; both the active and selected agents change their traits.

slide-3
SLIDE 3

13

Extended Cultural Transmission Model

  • n by n square lattice with wrap-around boundary
  • Population density p of individuals occupying lattice sites
  • Each agent is characterized by

– the direction it is facing and – a meme list with s elements.

  • Note: A meme represents the basic unit of cultural transmission, analogous

to the gene as the basic unit of genetic transmission (term coined by Richard Dawkins).

  • Lattice site values:

– An empty site has value 0. – An agent site is a list of integers: {d, {m1, …, ms}}

  • d: random integer between 1 and 4 (north, south, east, west)
  • mk: meme k with an integer value between 1 and M.

14

Cultural Transmission Model (Simulation Results)

  • cultureSpreadingShared program on a 25 by 25 lattice
  • 2 memes with 2 possible values (1 or 2)
  • 75% population density
  • 500 time steps.

Step 1 Step 500

15

Cultural Exchange

Social Status and Role Models

16

Social Status and Role Models

  • Another variant of the Cultural Transmission Model
  • Two people with unequal social status interact culturally:

– Individual with lower status is more likely to adopt a meme value

  • f the individual with higher status.

– The meme value of the higher status individual will remain unchanged.

  • Example: adoption of a role-model’s attitude(s)
  • Site representation: {direction, status, memelist}

– direction and memelist as in the previous model – status: integer 0 or 1

17

Social Status and Role Models (Simulation Results)

  • socialStatus program on a 25 by 25 lattice
  • 2 memes with 2 possible values (1 or 2)
  • 70% population density
  • 500 time steps.

Step 1 Step 500

18

Social Status and Role Models (Simulation Results)

  • socialStatus program on a 100 by 100 lattice
  • 2 memes with 2 possible values (1 or 2)
  • 70% population density
  • 500 time steps.

Step 1 Step 100

slide-4
SLIDE 4

19

Grouping and Conforming

Forming Neighbourhoods

20

Forming Neighbourhoods

  • Previous models: bilateral interactions between two

individuals

  • Many social phenomena can be better described in terms of

interactions between an individual and a group of other people.

21

Schelling Model (Self-Forming Neighbourhoods)

  • Thomas Schelling (1978) proposed a model for self-

forming neighbourhoods based on the desire of people to live with their own kind.

  • An individual is happy or unhappy with the number of

nearest neighbours who are like him/her.

  • An unhappy individual can move to the nearest empty site

that has a sufficient number of similar neighbours.

  • Spatial segregation or ghettoization occurs spontaneously,

without being imposed by a central authority (emergence!)

  • Can result in clustering of people by

– gender, age, race, beliefs, …

22

Self-Forming Neighbourhoods

  • n by n square lattice with wrap-around boundary
  • Population density p of individuals occupying lattice sites
  • Lattice site values:

– An empty site has value 0. – An agent site is a list of integers: {d, {a1, …, av}}

  • d: random integer between 1 and 4 (north, south, east, west)
  • ak: attribute k with an integer value between 1 and w.

– The attributes {a1, …, av} may include unchangeable traits

  • race, gender, ethnic identity, …

– and/or changeable beliefs

  • political views, moral values, personal interests, …
  • neighborhood program on a 20 by 20 lattice
  • ne attribute with 2 possible values (1 or 2)
  • 60% population density
  • 500 time steps.

23

Self-Forming Neighbourhoods (Simulation Results)

Step 1 Step 500

24

Grouping and Conforming

Segregation

slide-5
SLIDE 5

25

Segregation Model

  • Two types of turtles in a pond: red and green turtles.
  • The red and green turtles get along with each other.
  • But each turtle wants to make sure to live near some of

“its own.”

– Each red turtle wants to live near at least some red turtles. – Each green turtle wants to live near at least some green turtles.

  • Similar phenomena:

– Housing patterns in cities – Ethnic communities – Professional communities (Ponte Veccio, Florence; university campus) – …

26

Segregation

27

Social Networking

Nonlocal Movement

28

Social Networking

  • Models with spatial neighbourhoods are realistic in

situations such as a social gathering (a party) or in an

  • rganization (a company), where people physically interact

in space.

  • However, in human societies—with its economic and

social phenomena—not all interactions are spatial.

  • Technology also influences interactions (internet, email,

telephone, mail, …).

  • In the following we look at one model for nonlocal

interaction and movement.

29

Nonlocal Movement (Extension of Schelling Model)

  • n by n square lattice with wrap-around boundary
  • Population density p of individuals occupying lattice sites
  • Population consists of two types of individuals:

– A fraction g are of one type and a fraction (1-g) are of the other type.

  • Lattice site values:

– An empty site has value 0. – An agent site is an integer: t

  • t: integer 1 or 2, indicating what type the agent is
  • For each time step:

– An agent which finds less than 50% of its neighbours share the same type wants to move. – For agents who want to move an empty site is determined. – Each agent that wants to move and has an empty site to move to is relocated, leaving an empty site behind.

  • flight program on a 20 by 20 lattice
  • v = 1 attribute with w = 2 possible values
  • 60% population density
  • 500 time steps.

30

Nonlocal Movement: Simulation Results

Step 1 Step 500

slide-6
SLIDE 6

31

  • flight program on a 100 by 100 lattice
  • v = 1 attribute with w = 2 possible values
  • 60% population density
  • 500 time steps.

Nonlocal Movement: Simulation Results

Step 1 Step 500

32

References

  • Most of the simulations are based on:

– Gaylord, R. and D’Andria, L., Simulating Society, New York, Springer, 1991.

  • Other references:

– Axelrod, R., The Complexity of Cooperation: Agent-Based Models of Competition and Cooperation, Princeton, NJ, Princeton University Press, 1997. – Schelling, T. C., Micromotives and Macrobehavior, New York, W. W. Norton, 1978. – Wilensky, U., Connected Models, Center for Connected Learning and Computer-based Modeling, Northwestern University, Evanston, IL.