
SLIDE 1
RPCs IMRT Phantoms October 2007 SWAAPM RPCs Phantom Team Paola - - PDF document
RPCs IMRT Phantoms October 2007 SWAAPM RPCs Phantom Team Paola Alvarez Geoffrey S. Ibbott Carrie Amador Sophia Jaramillo Teresa Collier Mary Lou Lesseraux David S. Followill Jessica Lowenstein Sarai Garcia Andrea Molineu Franklin
50 100 150 200 250 300 2001 2002 2003 2004 2005 2006 2007
Year Phantom s Mailed
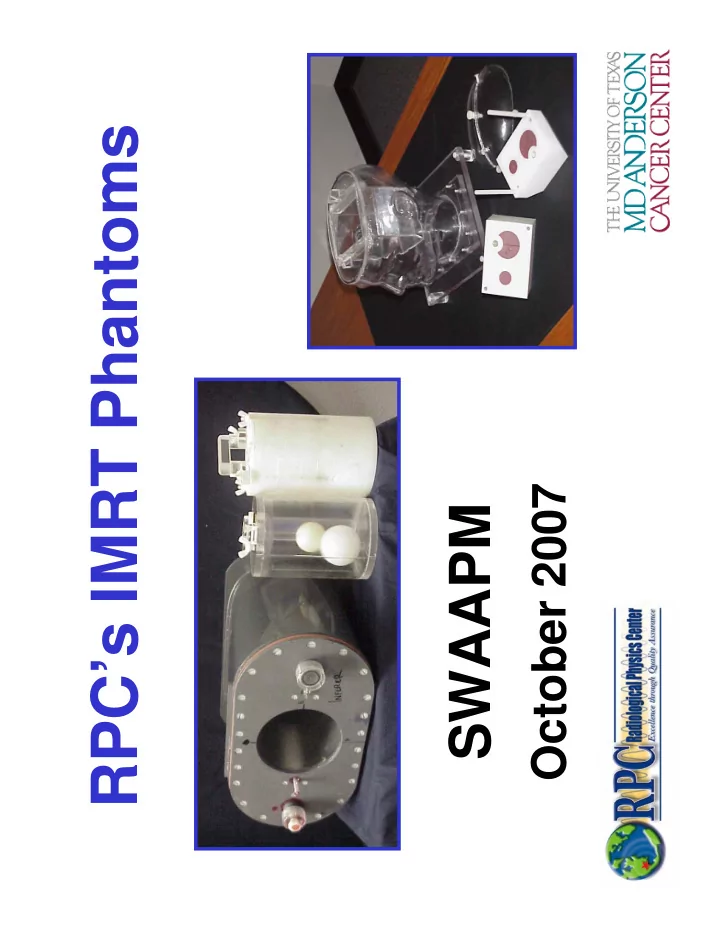
SRS Head Liver Prostate Thorax H&N
Dose Response Curve. Lot 36306-002I
y = 40.511x3 - 22.121x2 + 6.9223x R2 = 0.9988
0.00 2.00 4.00 6.00 8.00 10.00 12.00 14.00 16.00 0.000 0.100 0.200 0.300 0.400 0.500 0.600 0.700 0.800 0.900
Net OD Dose (Gy)
Dose Response Curve
4 cm diameter 4 TLD
2 cm diameter 2 TLD
1 cm diameter 2 TLD
radiochromic films
Secondary PTV Primary PTV Organ at Risk
Designed in collaboration with RTOG; Molineu et al, IJROBP, October 2005
Distance to agreement region Dose regions
0.57-1.23 0.49-1.15 range 419 721 1447 count 2.9 0.046 0.050 std dev 0.1 0.98 0.99 mean Displ.(mm) 2PTV 1PTV
Right Left Profile
2 4 6 8
1 2 3 4 5 6 7 8 Distance (cm) Dose (Gy)
RPC Film Institution Values
Primary PTV
Secondary PTV
Right Left
Anterior Posterior Profile
2 4 6 8
1 2 3 4 Distance (cm) Dose (Gy)
RPC Film Institution Values RPC Regression Institution Regression
Primary PTV
Organ at Risk
Anterior Posterior
Average displacment 0 mm 0 mm 1 mm 0 mm
Right Left Profile
2 4 6 8
1 2 3 4 5 6 7 8 Distance (cm) Dose (Gy)
RPC Film Institution Values
Primary PTV
Secondary PTV
Right Left
Anterior Posterior Profile
2 4 6 8
1 2 3 4 Distance (cm) Dose (Gy)
RPC Film Institution Values RPC Regression Institution Regression
Primary PTV
Organ at Risk
Anterior Posterior
TLD 5-8% low 10 mm shift
Anterior Posterior Profile
2 4 6 8
1 2 3 4
Distance (cm) Dose (Gy)
Primary PTV
Organ at Risk
Anterior Posterior
Average displacment 4 mm
Hot spots (~10%) and odd differences in dose distribution
Hot spots (~20%) due to indexing error
19 13 65 419 total 14 8 39 301 80 Varian 1 5 22 73 TomoTherapy 4 2 10 56 71 Siemens 1 2 11 35 60 Elekta 5 100 BrainLab Dose and DTA DTA Dose Criteria Failed Attempts Pass Rate (%) Linear Accelerator Manufacturer
19 13 65 419 total 2 3 24 79 Other 5 4 7 59 73 XiO 1 5 22 73 TomoTherapy 8 4 33 168 73 Pinnacle 3 4 10 114 85 Eclipse 1 7 32 75 Corvus Dose and DTA DTA Dose Criteria Failed Attempts Pass Rate (%) Treatment planning system
19 13 65 418
total
1 5 26 77
Other
2 1 13 77
Varian/Other
3 2 4 37 76
Varian/XiO
5 3 22 121 75
Varian/Pinnacle
3 3 9 110 86
Varian/Eclipse
1 5 22 73
Varian/Corvus
1 1 6 67
Siemens/Other
1 1 1 13 77
Siemens/XiO
3 5 27 70
Siemens/Pinnacle
1 8 88
Siemens/Corvus
2 4 50
Elekta/Other
1 1 2 9 56
Elekta/XiO
1 6 21 67
Elekta/Pinnacle
1 1
Elekta/Corvus Dose and DTA DTA Dose Criteria Failed Attempts Pass Rate (%) Manufacturer/TPS Combination
19 13 65 419 total 1 1 Experimental 1 3 17 76 TomoTherapy 15 10 47 279 74 Segmental 1 5 12 50 IMAT 3 2 9 110 87 Dynamic MLC Dose and DTA DTA Dose Criteria Failed Attempts Pass Rate (%) IMRT technique
10 20 30 40 50 60 70 80 90 ≤0.5 0.51-0.75 0.76-1.0 1.01-1.25 1.26-1.5 ≥1.51
10 20 30 40 50 60 70 80 90 100 1 2 3 4 5 6 ≥7
Imaging insert Dosimetry insert
Bladder Bladder Femoral Head Femoral Head Prostate Rectum Rectum Prostate
Distance to agreement region Dose region
0.92 - 1.06 range 91 92 184 count 2.483 3.926 0.029 std dev 0.89
1.00 mean DTA rectum (mm) DTA bladder (mm) PTV
Anterior Posterior Profile- Sagittal Plane
1 2 3 4 5 6 7 8
1 2 3 4 5 6 7
Distance (cm) Dose (Gy)
Rectum Anterior Posterior
Average displacement 1 mm
Prostate
Superior Inferior Profile - Coronal Plane
1 2 3 4 5 6 7 8
1 2 3 4 5 6 7
Distance (cm) Dose (Gy)
Superior Inferior Prostate Bladder
Average displacement
8 mm DTA
1 16 93 total 1 11 69 83 Varian 2 100 TomoTherapy 3 17 82 Siemens 2 5 60 Elekta Dose and DTA DTA Dose Criteria Failed Attempts Pass Rate (%) Linear Accelerator Manufacturer
1 16 93 total 1 2 10 70 Other 3 17 82 XiO 9 45 80 Pinnacle 2 21 90 Eclipse Dose and DTA DTA Dose Criteria Failed Attempts Pass Rate (%) Treatment planning system
1 16 93 total 3 100 Other 1 10 90 Varian/XiO 7 32 78 Varian/Pinnacle 2 21 90 Varian/Eclipse 1 1 5 60 Varian/Corvus 2 7 71 Siemens/XiO 8 100 Siemens/Pinnacle 1 2 50 Siemens/Corvus 2 5 60 Elekta/Pinnacle Dose and DTA DTA Dose Criteria Failed Attempts Pass Rate (%) Manufacturer/TPS Combination
1 16 93 total 2 100 TomoTherapy 12 69 83 Segmental 2 3 33 IMAT 1 2 19 84 Dynamic MLC Dose and DTA DTA Dose Criteria Failed Attempts Pass Rate (%) IMRT technique
replaced target more accurate setup upgraded MLC leaves updated software version adjusted leaf end modeling remeasured PDD and modeled beam based on new values input new output factors
provide a comprehensive evaluation of IMRT for clinical trials
The investigation was supported by PHS grants CA10953 and CA81647 awarded by the NCI, DHHS.
http://rpc.mdanderson.org/rpc/