
SLIDE 1
INFN School of Statistics 2013
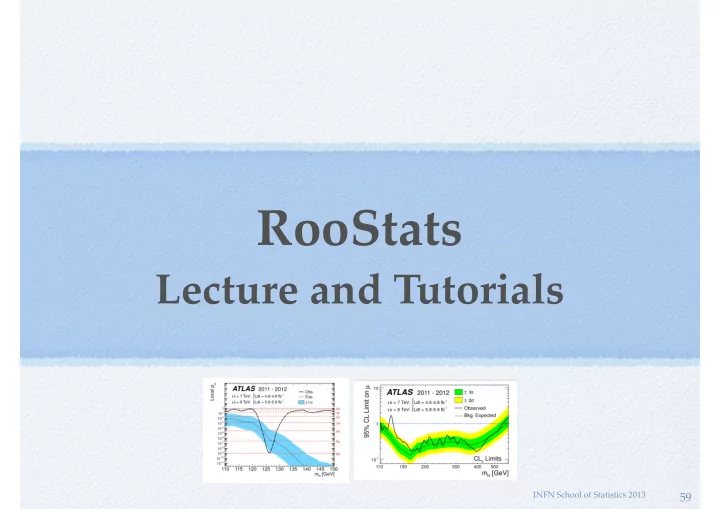
RooStats
Lecture and Tutorials
59
RooStats Lecture and Tutorials INFN School of Statistics 2013 59 - - PowerPoint PPT Presentation
RooStats Lecture and Tutorials INFN School of Statistics 2013 59 Outline Introduction to RooFit Basic functionality Model building using the workspace Composite models Exercises on RooFit: building and fitting models Introduction to
INFN School of Statistics 2013
59
Terascale Statistics School 2015
Introduction to RooFit Basic functionality Model building using the workspace Composite models Exercises on RooFit: building and fitting models Introduction to RooStats Interval estimation tools (Likelihood/Bayesian) Hypothesis tests Frequentist interval/limit calculator (CLs) Exercises on interval/limit estimation and discovery significance (hypothesis test)
60
Terascale Statistics School 2015
Collaborative project to provide and consolidate advanced statistical tools needed by LHC experiments Joint contribution from ATLAS, CMS, ROOT and RooFit
developments over-sighted by ATLAS and CMS statistics committees initiated from previous code developed in ATLAS and CMS used by both collaborations
61
Terascale Statistics School 2015
Common framework for statistical calculations
work on arbitrary models and datasets factorize modeling from statistical calculations implement most accepted techniques frequentists, Bayesian and likelihood based tools possible to easy compare different statistical methods provide utility for combinations of results using same tools across experiments facilitates the combinations of results
62
Terascale Statistics School 2015
63
Terascale Statistics School 2015
Built on top of RooFit
generic and convenient description of models (probability density function or likelihood functions) provides workspace (RooWorkspace) container for model and data and can be written to disk inputs to all RooStats statistical tools convenient for sharing models (e.g digital publishing of results) easily generation of models (workspace factory and HistFactory tool) tools for combinations of model (e.g. simultaneous pdf)
Use of ROOT core libraries:
minimization (e.g. Minuit), numerical integration, etc... additional tools provided when needed (e.g. Markov-Chain MC)
64
Terascale Statistics School 2015
C++ interfaces and classes mapping to real statistical concepts
65
GetHypoTest GetInterval
Terascale Statistics School 2015
ProfileLikelihoodCalculator
interval estimation using asymptotic properties of the likelihood function
BayesianCalculator
interval estimation based on Bayes theorem using adaptive numerical integration
MCMCCalculator
Bayesian calculator using Markov-Chain Monte Carlo
HypoTestInverter
invert hypothesis test results to estimate an interval CLs limits, FC interval
NeymanConstruction and FeldmanCousins
frequentist interval calculators
HybridCalculator, FrequentistCalculator
frequentist hypothesis test calculators using toy data (difference in treatment of nuisance parameters)
AsymptoticCalculator
hypothesis tests using asymptotic properties of likelihood function 66
Interval Calculators HypoTest Calculators
Terascale Statistics School 2015
ModelConfig class input to all Roostats calculators
contains a reference to the RooFit workspace class provides the workspace meta information needed to run RooStats calculators
pdf of the model stored in the workspace what are observables (needed for toy generations) what are the parameters of interest and the nuisance parameters global observables (from auxiliary measurements) for frequentist calculators prior pdf for the Bayesian tools
ModelConfig can be imported in workspace for storage and later retrieval
67
Terascale Statistics School 2015
ModelConfig must be built after having the workspace Identify all the components which are present in the workspace Some tools (Bayesian) require to specify prior pdf ModelConfig can be imported in workspace to be then stored in a file
//specify components of model for statistical tools ModelConfig modelConfig(“G(x|mu,1)”); modelConfig.SetWorkspace(workspace); //set components using the name of ws objects modelConfig.SetPdf( “normal”); modelConfig.SetParameterOfInterest(“poi”); modelConfig.SetObservables(“obs”);
//can import modelConfig into workspace too workspace.import(*modelConfig); //Bayesian tools would also need a prior modelConfig.SetPriorPdf( “prior”);
68
Terascale Statistics School 2015
Method based on properties of the likelihood function Profile likelihood function: Uses asymptotic properties of λ based on Wilks’ theorem: from a Taylor expansion of logλ around the minimum: ➔ -2logλ is a parabola (λ is a gaussian function) ➔ interval on μ from logλ values Method of MINUIT/MINOS lower/upper limits for 1D contours for 2 parameters
μ
69
maximize w.r.t nuisance parameters ν and fix POI μ maximize w.r.t. all parameters
λ is a function of only the parameter of interest μ
λ(µ) = L(x|µ, ˆ ˆ ν) L(x|ˆ µ, ˆ ν)
Terascale Statistics School 2015
For one-dimensional intervals: 68% CL (1 σ) interval : 95% CL interval :
LikelihoodIntervalPlot can plot the 2D contours
// create the class using data and model ProfileLikelihoodCalculator plc(*data, *model); // set the confidence level plc.SetConfidenceLevel(0.683); // compute the interval LikelihoodInterval* interval = plc.GetInterval(); double lowerLimit = interval->LowerLimit(*mu); double upperLimit = interval->UpperLimit(*mu); // plot the interval LikelihoodIntervalPlot plot(interval); plot.Draw(); 70
∆logλ = 0.5 ∆logλ = 1.96 μ
Terascale Statistics School 2015
RooStats provides classes for
marginalize posterior and estimate credible interval support for different integration algorithms: adaptive (numerical) MC integration Markov-Chain can work with models with many parameters (e.g few hundreds)
Bayesian Theorem
nuisance parameters marginalization posterior probability
likelihood function
prior probability normalisation term POI data
P(µ|x) = R L(x|µ, ν)Π(µ, ν)dν RR L(x|µ, ν)Π(µ, ν)dµdν
71
Terascale Statistics School 2015
BayesianCalculator class
posterior and interval estimation using numerical integration
working only for one parameter of interest but can integrate (marginalize) many nuisance parameters support for different integration algorithms,
using BayesianCalculator::SetIntegrationType
adaptive numerical (default type),
working only for few nuisances (< 10)
Monte Carlo integration (PLAIN, MISER, VEGAS) TOYMC : average from toys where the
nuisance parameters are sampled from a given p.d.f. (nuisance pdf), but can work in model with many parameters
can compute: central interval
a shortest interval
provide plot of posterior and interval
BayesianCalculator bc(data, model); bc.SetConfidenceLevel(0.683); bc.SetLeftSideTailFraction(0.5); bc.SetIntegrationType(“ADAPTIVE”); SimpleInterval* interval = bc.GetInterval(); double lowerLimit = interval->LowerLimit(); double upperLimit = interval->UpperLimit(); RooPlot * plot = bc.GetPosteriorPlot(); plot->Draw();
Example: 68% CL central interval
72
Terascale Statistics School 2015
MCMCCalculator mc(data, model); mc.SetConfidenceLevel(0.683); mc.SetLeftSideTailFraction(0.5); SequentialProposal sp(0.1); mc.SetProposalFunction(sp); mc.SetNumIters(1000000); mc.SetNumBurnInSteps(50); MCInterval* interval = bc.GetInterval(); RooRealVar * s = (RooRealVar*) model.GetParametersOfInterest()->find(“s”); double lowerLimit = interval->LowerLimit(*s); double upperLimit = interval->UpperLimit(*s); MCMCIntervalPlot plot(*interval);
MCMCCalculator class
integration using Markov-Chain Monte Carlo (Metropolis Hastings algorithm) can deal with more than one parameter
can work with many nuisance parameters e.g. used in Higgs combination with more than 300 nuisances possible to specify ProposalFunction multivariate Gaussian from fit result Sequential proposal can visualize posterior and also the chain result
MCMCCalculator
73
Terascale Statistics School 2015
RooStats provides standard tutorials taking all as input workspace, ModelConfig and data set names StandardProfileLikelihoodDemo.C StandardBayesianNumericalDemo.C StandardBayesianMCMCDemo.C
74
run ProfileLikelihoodCalculator - get interval and produce plot root[]StandardProfileLikelihoodDemo("ws.root","w","ModelConfig","data") run Bayesiancalculator: get a credible interval and produce plot of posterior function root[]StandardBayesianNumericalDemo("ws.root","w","ModelConfig","data") run bayesian MCMCCalculator: get a credible interval and produce plot of posterior function root[]StandardBayesianMCMCDemo("ws.root","w","ModelConfig","data")
INFN School of Statistics 2013
Follow the Twiki page at
https://twiki.cern.ch/twiki/bin/view/RooStats/RooStatsTutorialsMarch2015
75
INFN School of Statistics 2013
Hypothesis tests in RooStats using toys and asymptotic formulae Hypothesis test inversion Limit and interval calculators CLs, Feldman-Cousins
76
Terascale Statistics School 2015
Ingredients: Null Hypothesis: the hypothesis being tested (e.g. θ = θ0 ), assumed to be true and one tries to reject it Alternate Hypothesis: the competitive hypothesis (e.g. θ ≠ θ0 ) w is the critical region, a subspace of all possible data: size of test : α = P( X ∊ w | H0 ) power of test : 1- β = P( X ∊ w | H1 ) Test statistics: a function of the data, t(X) ,used for defining the
critical region in multidimensional data: X ∊ w ➞ t(X) ∊ wt
77
Terascale Statistics School 2015
Define null and alternate model using ModelConfig
can use ModelConfig::SetSnapshot(const RooArgSet &) to define parameter values for the null in case of a common model (e.g. μ = 0 for the B model)
Select test statistics to use Select calculator
Use toys or asymptotic formula to get sampling distribution
FrequentistCalculator or HybridCalculator have different treatment of nuisance parameters
78
Terascale Statistics School 2015
Test statistics maps multidimensional space in one, in a way relevant to the hypothesis being tested preferred choice is profile likelihood ratio which has known asymptotic distribution
79
RooStats has the three common test statistics used in the field (and more)
λ(µ) = Ls+b(µ, ˆ ˆ ν)/Ls+b(ˆ µ, ˆ ν)
QLEP = Ls+b(µ = 1)/Lb(µ = 0)
QT EV = Ls+b(µ = 1, ˆ ˆ ν)/Lb(µ = 0, ˆ ˆ ν0)
QLEP Probability Density signal + background background-only QLEP Probability Density signal + background background-only QLEP Probability Density signal + background background-only Terascale Statistics School 2015
Generate toys using nuisance parameter at their conditional ML estimate ( θ = θμ) by fitting them to the observed data Treat constraint terms in the likelihood (e.g. systematic errors) as auxiliary measurements introduce global observables which will be varied (tossed) for each pseudo-experiment L = Poisson( nobs | μ +b) Gaussian( b0 | b, σb)
b0 is a global observables, varied for each toys but it needs to be considered constant when fitting nobs is the observable which is part of the data set μ is the parameter of interest (poi) b is the nuisance parameter
80
^
Terascale Statistics School 2015
Nuisance parameters are integrated using their pdf (the constraint term) which is interpreted as a Bayesian prior integration is done by generating for each toys different nuisance parameters values need to have a pdf for the nuisance parameters (often it
can be derived automatically from the model) L = Poisson( nobs | μ +b) Gaussian( b| b0, σb) L = ∫ Poisson( nobs | μ +b) Gaussian( b| b0, σb) db
81
Terascale Statistics School 2015
Define the models N.B for discovery significance null is B model and alt is S+B
82
// create first HypoTest calculator (data, alt model , null model) FrequentistCalculator fcalc(*data, *sbModel, *bModel); // create the test statistics ProfileLikelihoodTestStat profll(*sbModel->GetPdf()); // use one-sided profile likelihood for discovery tests profll.SetOneSidedDiscovery(true); // configure ToyMCSampler and set the test statistics ToyMCSampler *toymcs = (ToyMCSampler*)fcalc.GetTestStatSampler(); toymcs->SetTestStatistic(&profll); fcalc.SetToys(1000,1000); // set number of toys for (null, alt) // run the test HypoTestResult * r = fcalc.GetHypoTest(); r->Print(); // plot test statistic distributions HypoTestPlot * plot = new HypoTestPlot(*r); plot->Draw();
Results HypoTestCalculator_result:
B model
S+B model
data
Terascale Statistics School 2015
Use the asymptotic formula for the test statistic distributions
null model (μ = μTEST ) half Χ2 distribution alt model (μ ≠ μTEST ) non-central Χ2 use Asimov data to get the non centrality parameter Λ = (μ-μTEST)/σ p-values for null and alternate can be obtained without generating toys
83
➡
see Cowan, Cranmer, Gross, Vitells, arXiv:1007.1727,EPJC 71 (2011) 1-1
λ(µ) = L(x|µ, ˆ ˆ ν) L(x|ˆ µ, ˆ ν)
λ(μ) = 0 for μ < 0 (discovery) μ < μTEST (limits) ^ ^
Terascale Statistics School 2015
Performing the tests for different mass hypotheses (i.e different signal models):
84
Terascale Statistics School 2015
confidence intervals
85 They explained that in statistical theory there is a one-to-
confidence interval. (The confidence interval is a hypothesis test for each value in the interval.) The Neyman-Pearson Theorem states that the likelihood ratio gives the most powerful hypothesis test. Therefore, it must be the standard method of constructing a confidence interval. I decided to start reading about hypothesis testing…
from G. Feldman visiting Harvard statistics department
Terascale Statistics School 2015
Performing an hypothesis test at each value of the parameter Interval can be derived by inverting the p-value curve, function
value of μ which has p-value α (e.g. 0.05), is the upper limit
86
Terascale Statistics School 2015
use one-sided test for upper limits (e.g. one-side profile likelihood test statistics) use two-sided test for a 2-sided interval
87
1-α = 68.3%
lower limit upper limit
Example: 1-σ interval for a Gaussian measurement
Terascale Statistics School 2015
Input is an Hypothesis Test calculator: Frequentist/Hybrid/AsymptoticCalculator possible to customize test statistic, number of toys, etc.. N.B: null model is S+B, alternate is B only model Compute an Interval (result is a ConfInterval object): scan given interval of µ and perform hypothesis tests compute upper/lower limit from scan result can use CLs = CLs+b / CLb for the p-value result (HypoTestInverterResult) contains all the hypothesis test results for each scanned µ value can compute expected limits and bands
88
Terascale Statistics School 2015
HypoTestInverter class in RooStats
89 // create first HypoTest calculator (N.B null is s+b model) FrequentistCalculator fc(*data, *bModel, *sbModel); HypoTestInverter calc(*fc); calc.UseCLs(true); // configure ToyMCSampler and set the test statistics ToyMCSampler *toymcs = (ToyMCSampler*)fc.GetTestStatSampler(); ProfileLikelihoodTestStat profll(*sbModel->GetPdf()); // for CLs (bounded intervals) use one-sided profile likelihood profll.SetOneSided(true); toymcs->SetTestStatistic(&profll); // configure and run the scan calc.SetFixedScan(npoints,poimin,poimax); HypoTestInverterResult * r = calc.GetInterval(); // get result and plot it double upperLimit = r->UpperLimit(); double expectedLimit = r->GetExpectedUpperLimit(0); HypoTestInverterPlot *plot = new HypoTestInverterPlot("hi","",r); plot->Draw();
Terascale Statistics School 2015
B
S+B
Data
90
Hypothesis test results for each scanned point p-value, CLs+b (or CLb) is integral of S+B (or B) test statistic distribution from data value Scan result
How expected limit and bands are
(median, +/1,2 sigma) of the B model test statistic distribution (i.e. use quantile as the observed value)
Terascale Statistics School 2015
AsymptoticCalculator class for HypoTestInverter
use the asymptotic formula for the test statistic distributions
𝜓2 approximation for the profile likelihood ratio
see G. Cowan et al., arXiv:1007.1727,EPJC 71 (2011) 1-1
p-values CLs+b (null) and CLb (alt) obtained without generating toys also expected limits from the alt distribution
91
S+B model
B model CLb CLs+b
// create first HypoTest calculator (N.B null is s+b model) AsymptoticCalculator ac(*data, *bModel, *sbModel); HypoTestInverter calc(*ac); // run inverter same as using other calculators ........
Terascale Statistics School 2015
95% CL limit on a Gaussian measurement: Gauss(x,μ,1), with μ≥0
92
deficit, observation x = -1.5 excess, observation x = 1.5
use CLs as p-value to avoid setting limits which are too good
Terascale Statistics School 2015
By computing limits for different mass hypothesis:
93
Terascale Statistics School 2015
94
Downward fluctuations in searches for excesses
Classic example: Upper limit on mean of Gaussian based on measurement x (in units of ).
Bob Cousins, CMSDAS, 1/2012 60
Frequentist 1-sided 95% C.L. Upper Limits, based on = 1 – C.L. = 5% (called CLsb at LEP). For x < 1.64 the confidence interval is the null set! If 0 in model, as measured x becomes increasingly negative, standard classical upper limit becomes small and then null. Issue acute 15-25 years ago in expts to measure e mass in (tritium decay): several measured m
2 < 0.
=0
Measured Mean x
1 2 3 4 5 6 7 µ Mean 1 2 3 4 5 6 7 8 9 10 Measured Mean x
1 2 3 4 5 6 7 µ Mean 1 2 3 4 5 6 7 8 9 10
CLs or Bayesian
Feldman-Cousins interval from Bob Cousins:
Terascale Statistics School 2015
HypoTestInverter class can compute also a Feldman-Cousins interval need to use FrequentistCalculator and CLs+b as p-value use the 2-sided profile likelihood test statistic
95
λ(µ) = L(x|µ, ˆ ˆ ν) L(x|ˆ µ, ˆ ν)
Terascale Statistics School 2015
96
from Kyle Cranmer:
ROOT Users Workshop 11-14 March 2013
can compute also a Feldman-Cousins interval
97
Terascale Statistics School 2015
Standard ROOT macro to run the Hypothesis Test inversion. Inputs to the macro:
workspace file, workspace name name of S+B model (null) and for B model (alt)
if no B model is given, use S+B model with poi = 0
data set name calculator type: frequentist (= 0), hybrid (=1), or asymptotic (=2) test statistics
use CLs or CLs+b for computing limit number of points to scan and min, max of interval
load the macro after having created the workspace and saved in file SPlusBExpoModel.root root[] .L StandardHypoTestInvDemo.C run for CLs (with frequentist calculator (type = 0) and one-side PL test statistics (type = 3) scan 10 points in [0,100] root[] StandardHypoTestInvDemo("SPlusBExpoModel.root","w","ModelConfig","","data",0,3, true, 10, 0, 100) run for Asymptotic CLs (scan 20 points in [0,100]) root[] StandardHypoTestInvDemo(SPlusBExpoModel.root","w","ModelConfig","","data",2,3, true, 20, 0, 100) run for Feldman-Cousins ( scan 10 points in [0,100]) root[] StandardHypoTestInvDemo(SPlusBExpoModel.root","w","ModelConfig","","data",0,2, false, 10, 0, 100)
98
HistFactory – a new class of pdfs
– Assumes you can formulate signal/background in an analytical form – Often possible in e+e- experiments, shapes for hadron colliders cumbersome rely on MC simulation
Wouter Verkerke, NIKHEF
Analytical form: Gaussian+Polynomial Template form: Histogram (discrete)
Terascale Statistics School 2015
100
Terascale Statistics School 2015
Wouter Verkerke, NIKHEF
Simplify packaging and sharing of models
Class RooWorkspace
Statistical tests based on likelihoods from RooFit models
RooStats toolkit HistFactory package
Constructing models from Monte Carlo templates
101
Terascale Statistics School 2015
102
Graph of the full ATLAS Higgs combination model
Model has ~23.000 function objects, ~1600 parameters Reading/writing of full model takes ~4 seconds ROOT file with workspace is ~6 Mb
Terascale Statistics School 2015
RooFit/RooStats allow you to perform advanced statistical data/analysis LHC results (e.g. Higgs observation) Capable of using different tools and interpretations (Frequentist/Bayesian) on the same model Generic tools capable to deal with large variety of models
based on histograms or un-binned data multi-dimensional observations Provide tools to facilitate complex model building
HistFactory for histogram based analysis
103
Terascale Statistics School 2015
RooStats TWiki: https://twiki.cern.ch/twiki/bin/view/RooStats/WebHome RooStats users guide (not really completed)
http://root.cern.ch/viewcvs/branches/dev/roostats/roofit/roostats/doc/usersguide/RooStats_UsersGuide.pdf
For reference and citation: ACAT 2010 proceedings papers: http://arxiv.org/abs/1009.1003
RooStats tutorial macros: http://root.cern.ch/root/html534/tutorials/roostats/index.html HistFactory document: https://cdsweb.cern.ch/record/1456844/files/CERN-OPEN-2012-016.pdf RooStats user support:
Request support via ROOT talk forum: http://root.cern.ch/phpBB2/viewforum.php?f=15
(questions on statistical concepts accepted)
contact me directly (email: Lorenzo.Moneta at cern.ch )
Contacts for statistical questions:
ATLAS statistics forum: TWiki: https://twiki.cern.ch/twiki/bin/view/AtlasProtected/StatisticsTools CMS statistics committee: TWiki: https://twiki.cern.ch/twiki/bin/view/CMS/StatisticsCommittee
104
INFN School of Statistics 2013
Follow the Twiki page at
https://twiki.cern.ch/twiki/bin/view/RooStats/RooStatsTutorialsMarch2015
105