
SLIDE 1
6/12/2018 1
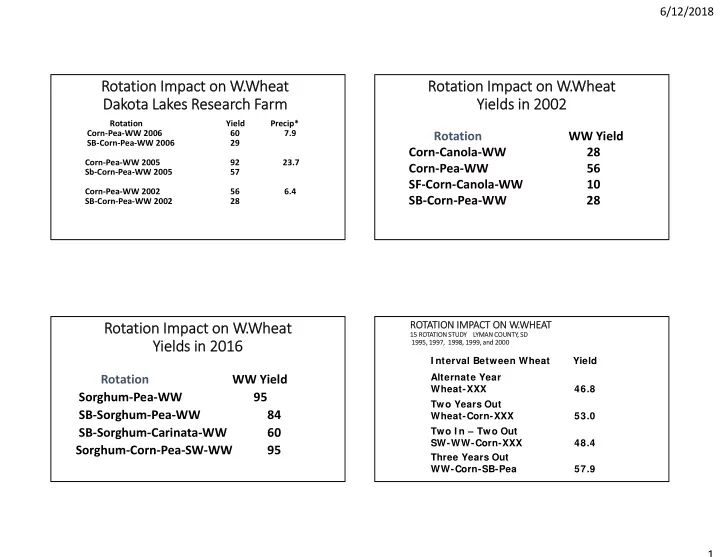
Ro Rotation Im Impact on
- n W.
W.Wheat Dak Dakota Lak Lakes Re Research Fa Farm
Rotation Yield Precip* Corn‐Pea‐WW 2006 60 7.9 SB‐Corn‐Pea‐WW 2006 29 Corn‐Pea‐WW 2005 92 23.7 Sb‐Corn‐Pea‐WW 2005 57 Corn‐Pea‐WW 2002 56 6.4 SB‐Corn‐Pea‐WW 2002 28
Ro Rotation Im Impact on
- n W.
W.Wheat Yi Yields in in 2002 2002
Rotation WW Yield Corn‐Canola‐WW 28 Corn‐Pea‐WW 56 SF‐Corn‐Canola‐WW 10 SB‐Corn‐Pea‐WW 28
Ro Rotation Im Impact on
- n W.
W.Wheat Yi Yields in in 2016 2016
Rotation WW Yield Sorghum‐Pea‐WW 95 SB‐Sorghum‐Pea‐WW 84 SB‐Sorghum‐Carinata‐WW 60 Sorghum‐Corn‐Pea‐SW‐WW 95
RO ROTATI TION IM IMPACT ON ON W. W.WHEAT
15 15 RO ROTATIO TION ST STUDY LY LYMAN COU COUNTY TY, SD SD 1995, 95, 1997 1997, 1998, 998, 1999, 99, and and 2000 2000