
SLIDE 1
Paleo CO2 (Ward).
Deep Ocean J. Hansen & M. Sato, Paleoclimate Implications for - - PowerPoint PPT Presentation
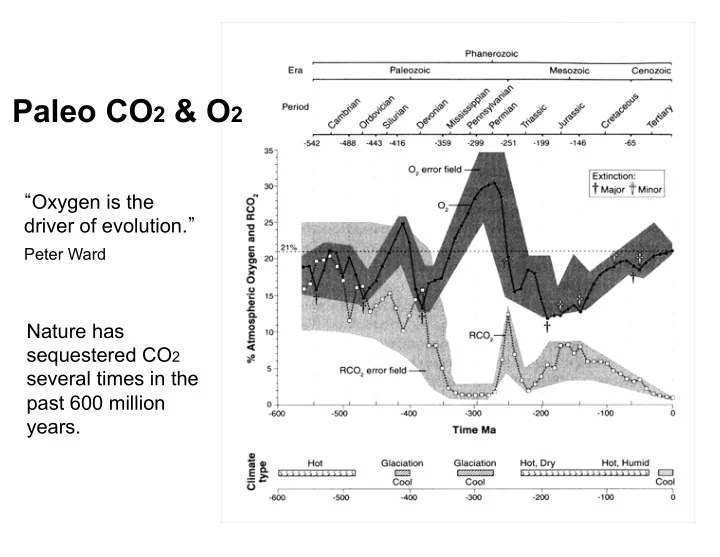
Paleo CO 2 & O 2 Oxygen is the driver of evolution. Peter Ward Nature has sequestered CO 2 several times in the past 600 million years. Paleo CO2 (Ward). Deep Ocean J. Hansen & M. Sato, Paleoclimate Implications for
Paleo CO2 (Ward).
Temps over Last 65 Million Years .
“Paleoclimate Implications for Human-Made Climate Change” Figure 1 in Climate Change, 2012 Inferences from Paleoclimate and Regional Aspects,
& Sijacki Springer-Verlag, Vienna 2012
Deep Ocean Deep Ocean
12,000 Years of Temps .
Phipps, Nature Geoscience, April 2013
5
UNCLASSIFI FIED
CO2 Sink %
James Hansen, 2013: Fig. 3 in “Doubling Down on Our Faustian Bargain”
from the last 20 million years, by van der Wal, cited in “Making Sense of Palaeoclimate Sensitivity,” Hansen et al., Nov. 12. Also, Snyder, Sept. 2016. fast feedback = +3°C at doubling (560 ppm) +1.5°C at 400 ppm fast + slow feedback = +5°C at 400 ppm Fast feedbacks include cloud cover, snow extent, sea ice, upper ocean heating, carbon emissions from permafrost & methane hydrates, and most aspects of dust & aerosol changes.
Slow feedbacks include albedo changes from changes in vegetation and ice sheet extent, plus weathering, plate tectonics, and some aspects of the carbon cycle. 1.2°C warming is
Nor does it include albedo effects of future shrinking snow & sea ice extent, time to heat the upper ocean, or positive feedbacks on permafrost & clouds. But it does not include 0.5°C warming hidden by sulfates. fast + slow feedback = +9°C at 560 ppm
Radiation Forcings IPCC AR5 . Figure TS.7: IPCC, AR5 (2013)
Sulfate Aerosol % .
James Hansen, Fig. 6a in Global Temperature Update Through 2012
The 1997-2017 rate of change is At that rate, “Both” will pass 2ºC above 1880 levels in 2059. “Land” in 2033. 2.2 for Sea, 2.3 for Both. 2.7ºC / 100 years for Land,
NASA, 5-year moving average
1951-80 Baseline
5-Year Moving Average by Latitude - NASA GISS
* = only S Patagonia & S Chile, S 25% of NZ
Arctic Sea Ice Volume .
Jan Feb Mar Apr May Jun Jul Aug Sep Oct Nov Dec
April June July September June Trend, 79+ July Trend, 79+ Sept Trend, 79+ Apr Trend, 00+ June Trend, 00+ July Trend, 00+ Sept Trend, 00+
Snow Observations, 1965-2012 2013 State of the Climate, American Meteorological Organization
Annual Average Cloud Observations, 1982-2012 2013 State of the Climate, American Meteorological Organization 2014 State of the Climate revised the time trend to 0.
1984 1988 1992 1996 2000 2004 2008
Cloud Cover (%)
Low Middle High
International Satellite Cloud Climatology Project dashed lines by Gene Fry less cooling clouds more warming clouds less warming clouds
net warming effect. Magnitude?
10 millennia ago, Earth’s surface warmed at a rate of 0.03°C / century. Current warming is 50-150 times as fast, but only 1/3 as much ice is left.
Greenland & Antarctic Ice Andrew Shepherd et al., “A Reconciled Estimate of Ice-Sheet Mass Balance”, Science 38(6111):1183-1189. Nov. 30, 2012 Ice Sheet Contribution to Global Sea Level Rise .
1 3 5 7 9 11
1992 1996 2000 2004 2008 2012
millimeters
Combined Greenland Antarctica
Alaska Permafrost .
Projections for average annual ground temperature at 1 meter deep. Blue is permafrost. Red surface is above freezing. Draft National Climate Assessment, Figure 22.5, 2013
US Dought Projection .
mean of 19 models
“Extreme” means individual model results
Future Rain in North America Global Climate Change in the United States, June 2009, NOAA et al. at 31
change from local baseline (1902-2010?)
Via NOAA: “Reds and oranges highlight lands around the Mediterranean that experienced significantly drier winters during 1971-2010 than the comparison period of 1902-2010.”
Corn, Wheat, Rice, Soy - US, China, India .
Corn
50 100 150 200 250 300 350 1990 1994 1998 2002 2006 2010
Million Metric Tons
US China India
Rice
40 80 120 160 200 240 1990 1994 1998 2002 2006 2010
Million Metric Tons
US China India
Wheat
20 40 60 80 100 120 140 1990 1994 1998 2002 2006 2010
Million Metric Tons
US China India
Soybeans
10 20 30 40 50 60 70 80 90 100 1990 1994 1998 2002 2006 2010
Million Metric Tons
US China India
World Food Prices .
Grain for ethanol,
Rice Wheat Corn
UN: Food & Agriculture Organization
J A J O J A J O J A J O J A J O J A J O J A J O J A J
Crop Response Graphs .
.0 .2 .4 .6 .8 1.0 40 50 60 70 80 90 100
°F (24-hour mean) Relative Yield / acre
Wheat C
n Soy
Wichita Des Moines Bismarck Pine Bluff Mean June Temps, ‘81-’10
CO2 Fertilization of Crops .
1.0 1.1 1.2 1.3 1.4 1.5 280 320 360 400 440 480 520 560
parts per million Relative Yield
Corn
Soy Rice 26 studies, ‘72-’06,
Hatfield 2011 study CO2 levels = 330 (‘72) to 380 ppm (‘06).
Nitrogen & water not constraining.
based
Hatfield 2011 today Kolkata Wheat
Crop Responses to +4°C, 2xCO2 (560 ppm)
.0 .2 .4 .6 .8 1.0 1.2 40 50 60 70 80 90 100
°F (24-hour mean) Relative Yield
Wheat C
n Soy
Mean June Temps
Nitrogen & water not constraining.
Wichita Des Moines Bismarck Pine Bluff Kolkata
Crop Responses to +6°C, 2 x CO2
.0 .2 .4 .6 .8 1.0 1.2 40 50 60 70 80 90 100
°F (24-hour mean) Relative Yield
Wichita Des Moines Bismarck Pine Bluff Kolkata India Mean June Temps
Green Jobs .
General Electric
US Renewable Electricity in 2050 .
Renewable Electricity Futures Study Hand, M.M. et al., 2012
Table 3-1 National Renewable Energy Laboratory Scenario: 80% Renewable by 2050 Low Demand, Technology Improvement
7% > TWh than 2012
US Total % Cap TWh GW Wind 34 560 PV 8 290 CSP 11 130 Hydro 13 170 Geoth. 3 25 Biom. 12 98 Gas 3 250 Coal 8 40 Nuke 8 50 Store 130
25% > GW than 2012 70% export 41% export 32% import 41% import 33% import 30% export
US Electricity Prices Lazard 2016
Wind Map American Wind Energy Association
Changes due to Carbon Tax
from REMI’s 2014 analysis, for the Citizens Climate Lobby
2015 2020 2025 2030 2035
MA = Mass.
The tax modeled rises from $10 / metric ton of CO2 in 2016, by $10 / T annually, to $200 / T in 2035. Collect it only at wellheads, mine mouths & borders (for carbon imports). Taxpayers get 100% of it back each year (= $ / Household or = $ / person). US CO2 emissions fall from 5.1 GT per year in 2015 to 2.6 GT in 2035. GNP is 0.2-0.4% higher over 2017-35. Jobs rise > 1% by 2025 (versus the no carbon tax baseline). Only the West South Central states suffer. Job gains are biggest in Health Care, Finance & Insurance, Retail, and Real
& Oil) and Mining suffer. The tax saves 10,000 lives a year (mostly from air pollution) by 2021 and 14,000 / year by 2031. Electricity in 2035 is 6% (250 TWh / year) below the base case. Coal (1,500 TWh / year now) is phased
750, nuclear 700, solar 200, and geothermal 100, but gas falls 500.
are George Shultz, Jim Hansen, Katherine Hayhoe, Bob Inglis et al. 300+ CCL chapters cover 430+ Congressional districts in 50 states. You are invited to join. Go to http://citizensclimatelobby.org.
Gross National Product
Gross Regional Products
Total Employment
tl