OSU KSU Farm Bill Decision Aid by J. Campiche, E. DeVuyst, G.A. - - PowerPoint PPT Presentation

osu ksu farm bill decision aid
SMART_READER_LITE
LIVE PREVIEW

OSU KSU Farm Bill Decision Aid by J. Campiche, E. DeVuyst, G.A. - - PowerPoint PPT Presentation

Farm Service 2014 Disclaimer Agency Farm Bill This information is based on my understanding of the 2014 Farm Bill This information is intended for educational purposes only Keep checking www.AgManager.info for updated information OSU


slide-1
SLIDE 1

OSU‐KSU Farm Bill Decision Aid

by J. Campiche, E. DeVuyst, G.A. Barnaby, and M. Taylor

2014 Farm Bill

Farm Service Agency

Disclaimer

  • This information is based on my understanding of the 2014 Farm Bill
  • This information is intended for educational purposes only
  • Keep checking www.AgManager.info for updated information
  • Excel‐based spreadsheet
  • Can be downloaded from

www.AgManager.info

  • Information you will need
  • FSA report 156EZ for each farm
  • FSA program yields
  • Commodity base acres
  • Farm yields 2008‐2012
  • APH/crop insurance information
  • Expected plantings 2014‐2018
  • Updates continuously posted
  • Monthly update of prices
  • Please report errors or

questions

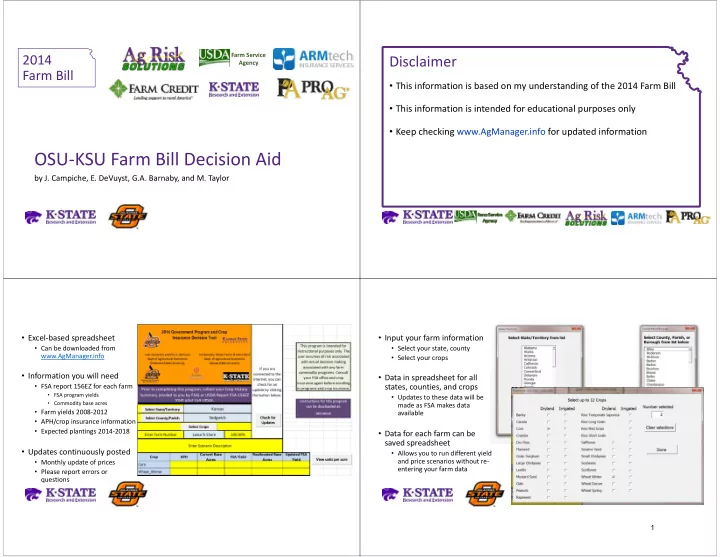
  • Input your farm information
  • Select your state, county
  • Select your crops
  • Data in spreadsheet for all

states, counties, and crops

  • Updates to these data will be

made as FSA makes data available

  • Data for each farm can be

saved spreadsheet

  • Allows you to run different yield

and price scenarios without re‐ entering your farm data 1

slide-2
SLIDE 2
  • APH
  • From crop insurance records
  • Will be used for SCO calculations
  • FSA data
  • Enter your base acres and

program yields for all crops

  • Decision to update based on

calculations

  • Notes in spreadsheet help
  • Updating yield and base?
  • Results presented with higher
  • f current/updated yields
  • Results with both reallocated

and current base

2008 2009 2010 2011 2012 2013 Units 76 30 bu/acre 22 55 60 47 bu/acre Enter your farm's historical yields Crop Corn Wheat_Winter Crop 2009 2010 2011 2012 2013 4‐Year Avg Ratio Reallocated Base Corn 300 75 0.250 75 Wheat_Winter 300 300 300 300 225 0.750 225 Planted Acres Crop 2008 2009 2010 2011 2012 2008 2009 2010 2011 2012 Corn 76 30 84.0 84.0 Wheat_Winter 22 55 60 28.0 55.0 60.0 Your Farm's Historical Yields 84.0 Your Farm's Update Yields with Plug Yields 28.0 County Substitute Yield 90% of Updated Average Current FSA Yield Updated FSA Yield 40.0 75.6 42.9 75.6 42.9

  • Next steps require your

expectations of the future…

  • Enter your plans for planted

acres by crop

  • Enter expected prices
  • Planting rotation going

forward

  • Kept the same here
  • Matters if you want to buy SCO
  • r opt for ARC‐IC
  • Price expectations
  • Try good prices and bad
  • 2017 has low prices (below

the reference prices) 2

slide-3
SLIDE 3
  • Now you can work on the

programs…

  • ARC‐IC
  • Input projected yields
  • Yields
  • Use linear trend, average
  • Custom yields (used APH)
  • Prices
  • Use FAPRI (2014)
  • Custom prices (low in 2017)
  • ARC‐IC
  • Payments made on 65%
  • f total base acres
  • Penalty will be too high

for most farms

  • Other notes
  • Paperwork burden higher

for this program

  • Changing your planted

acres will change the coverage (not decoupled)

  • Comparison to ARC‐CO

depends heavily on scenarios you pick

  • ARC‐CO
  • Input projected yields
  • Yields
  • Use linear trend, average
  • Custom yields (in 2015)
  • Prices
  • Use FAPRI (for 2014)
  • Custom prices (low in 2017)

2012 Price 2013 Price 6.890 $ 4.460 $ 7.770 $ 6.870 $ Corn 373.59 $ 321.29 $ 252.00 $ Crop ARC Benchmark ARC Guarantee 2014 Actual Revenue Wheat_Winter 264.13 $ 227.15 $ 234.39 $ Wheat_Winter 300.0 2.94 $ 5.50 $ 225.0 6.60 $ Crop Base Acres Loan Rate Reference Price Reallocated Base Acres Benchmark Price 2014 Corn 0.0 1.95 $ 3.70 $ 75.0 5.29 $ Wheat_Winter 39.0 12.0 39.0 39.0 39.0 Corn 72.0 30.0 72.0 72.0 72.0 Crop 2014 Yield 2015 Yield 2016 Yield 2017 Yield 2018 Yield Wheat_Winter 34.0 38.0 27.0 48.0 48.0 Corn 92.0 84.0 56.0 56.0 72.0

ARC‐County Enter Crop Yield Data for Your County

Crop 2009 Yield 2010 Yield 2011 Yield 2012 Yield 2013 Yield Crop 2014 Price 2015 Price 2016 Price 2017 Price 2018 Price Corn 3.500 $ 4.000 $ 4.000 $ 2.250 $ 4.000 $ Wheat_Winter 6.010 $ 5.750 $ 5.750 $ 4.250 $ 5.750 $ Crop 2009 Price 2010 Price 2011 Price Corn 3.550 $ 5.180 $ 6.220 $ Wheat_Winter 4.870 $ 5.700 $ 7.240 $ 37.36 $ 26.41 $ Payment Rate 69.29 $ ‐ $ Max Payment

3

slide-4
SLIDE 4
  • ARC‐CO Example
  • 2015 is a drought year
  • 2017 has low prices

(below the reference prices)

  • Payments in both years
  • Either low yields or low

prices will trigger ARC‐CO

  • Payment limits at 10% of

county revenue

  • NPV of payouts is greater

for updated base acres

Net Present Value 6,047 $ 9,398 $ Net Present Value ‐ $ 12,532 $ Total Discounted ARC Payments @ 5% Discount Rate Totals 2,382 $ 7,591 $ ‐ $ 6,753 $ ‐ $ 15,445 $ Wheat_Winter ‐ $ 5,344 $ ‐ $ 4,988 $ ‐ $ Crop 2014 2015 2016 2017 2018 Corn 2,382 $ 2,247 $ ‐ $ 1,765 $ ‐ $ ARC‐County Payments with Reallocated Base Acres Paid on 85% of Base Acres ‐ $ 2014 2015 2016 2017 2018 Wheat_Winter ‐ $ 7,126 $ ‐ $ 6,651 $ ‐ $ Totals ‐ $ 7,126 $ ‐ $ 6,651 $ ‐ $ Crop Corn ‐ $ ‐ $ ‐ $ ‐ $ Total Discounted ARC Payments @ 5% Discount Rate 12,532 $ ARC‐County Payments with Current Base Acres Paid on 85% of Base Acres

ARC‐CO will trigger for either low yields (2015) or low prices (2017) because it is based on revenue.

  • PLC example
  • Payments triggered

when prices fall below reference prices

  • No per acre

payments limits

  • Highest payout
  • 2017 due to low

prices (below the reference prices)

  • Updating base acres

not impactful

Crop Current Base Acres Loan Rate Reference Price 2018 Price

Price Loss Coverage Calculations

Reallocated Base Acres Crop 2014 Price 2015 Price 2016 Price 2017 Price 5.750 $ Corn 3.500 $ 4.000 $ 4.000 $ 2.250 $ 4.000 $ Wheat_Winter 6.010 $ 5.750 $ 5.750 $ 4.250 $ Wheat_Winter 300 2.94 $ 5.50 $ 225.0 Corn 1.95 $ 3.70 $ 75.0 Updated FSA Yield 75.6 42.9 15,860 $ 7,000 $ 8,860 $ 11,812 $ PLC Payments with Reallocated Base Acres and UPDATED FSA Yields PLC Payment NPV Crop Updated Base Acres 2014 2015 2016 2017 2018 Totals ‐ $ ‐ $ ‐ $ 13,674 $ ‐ $ Total Discounted PLC Payment @ 5% Discount Rate NPV ‐ $ 11,812 $ PLC Payments with Current Base Acres and UPDATED FSA Yields PLC Payment Crop Base Acres 2014 2015 2016 2017 Totals 964 $ ‐ $ ‐ $ 17,244 $ ‐ $ Total Discounted PLC Payment @ 5% Discount Rate Corn 75 964 $ ‐ $ ‐ $ 6,988 $ ‐ $ Wheat_Winter 225 ‐ $ ‐ $ ‐ $ 10,256 $ ‐ $ Corn ‐ $ ‐ $ ‐ $ ‐ $ ‐ $ Wheat_Winter 300 ‐ $ ‐ $ ‐ $ 13,674 $ ‐ $ 2018

  • SCO
  • Stacked on your existing

crop insurance

  • Coverage up to 86%
  • Same product as underlying

crop insurance (e.g. RP, RP‐HPE, Y)

  • Coverage by county
  • Only certain crops available
  • More crops in future years
  • Decision to enroll is annual
  • Only get SCO with PLC!

SCO payout for low county yield year only. Rest of years are a net cost (premium).

  • Results
  • Calculated using the NPV
  • f payments across all

years for each crop and program combination

  • Comparison of results

using updated and current base acres

  • Optimal program may

vary by crop

ARC‐County PLC SCO PLC+SCO ARC‐Ind $0 $0 ‐$777 ‐$777 $12,532 $11,812 $1,725 $13,537 $12,532 $11,812 $948 $12,760 $13,507 ARC‐County PLC SCO PLC+SCO ARC‐Ind $6,047 $7,000 ‐$777 $6,223 $9,398 $8,860 $1,725 $10,585 $15,445 $15,860 $948 $16,808 $13,507 Reallocate Y/N Best Option NPV Y PLC $7,000 Y PLC+SCO $10,585 17,585 $ Net Present Value of Payments The Good, the Bad, and the Ugly!! Corn Wheat_Winter Current Base Acres

Total NPV w/ Reallocated base acres

Crop Reallocated Base Acres Total NPV w/ Current base acres Corn Wheat_Winter Total NPV‐‐best option Corn Wheat_Winter

Differences between payouts may not be large and are highly dependent on data you enter.

4

slide-5
SLIDE 5

What to choose?

  • Best fit for your farm will depend on your preferences for risk

management

  • Protection against catastrophic price declines (PLC)
  • Protection against shallow revenue losses (ARC)

Or….

  • Highest program payments
  • Payment in 2014‐2015 likely for both ARC‐CO (wheat: yield loss, others: price

loss) and PLC (sorghum?)

  • How good you are at guessing where prices and yields will be in future years?

Farm Bill In‐Depth Educational Meetings:

  • January 12: Wichita
  • January 13: Pittsburg
  • January 14: Emporia
  • January 15: Ottawa
  • January 20: Salina
  • January 21: McPherson
  • January 22: Pratt
  • January 26: Goodland
  • January 27: Scott City
  • January 28: Liberal
  • January 29: Dodge City
  • February 10: Phillipsburg
  • February 11: Hays
  • February 12: Frankfort
  • February 13: Atchison

Resources for you…

www.AgManager.info

Click on the Farm Bill Icon!

  • Frequently Asked Questions
  • Reallocating Base
  • Updating Program Yield
  • Articles on Price Forecasts
  • Decision Tool
  • Much more!!!

USDA‐FSA decision aids: ARC/PLC, Dairy

www.fsa.usda.gov/FSA

Other models:

Both available at: www.fsa.usda.gov/arc‐plc National Association of Agricultural and Food Policy (NAAFP) led by the Food and Agricultural Policy Research Institute (FAPRI) at the University of Missouri, and the Agricultural and Food Policy Center (AFPC) at Texas A&M University National Coalition for Producer Education (NCPE), led by the University of Illinois

OSU‐KSU Farm Bill Decision Aid

Mykel Taylor mtaylor@ksu.edu 785‐532‐3033

2014 Farm Bill

Farm Service Agency

5