
SLIDE 1
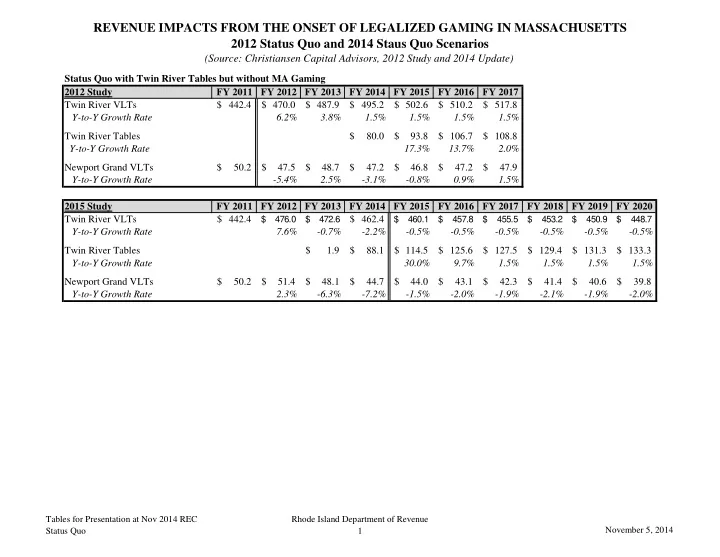
REVENUE IMPACTS FROM THE ONSET OF LEGALIZED GAMING IN MASSACHUSETTS 2012 Status Quo and 2014 Staus Quo Scenarios
(Source: Christiansen Capital Advisors, 2012 Study and 2014 Update)
Tables for Presentation at Nov 2014 REC Status Quo Rhode Island Department of Revenue 1 November 5, 2014
Status Quo with Twin River Tables but without MA Gaming 2012 Study FY 2011 FY 2012 FY 2013 FY 2014 FY 2015 FY 2016 FY 2017 Twin River VLTs 442.4 $ 470.0 $ 487.9 $ 495.2 $ 502.6 $ 510.2 $ 517.8 $ Y-to-Y Growth Rate 6.2% 3.8% 1.5% 1.5% 1.5% 1.5% Twin River Tables 80.0 $ 93.8 $ 106.7 $ 108.8 $ Y-to-Y Growth Rate 17.3% 13.7% 2.0% Newport Grand VLTs 50.2 $ 47.5 $ 48.7 $ 47.2 $ 46.8 $ 47.2 $ 47.9 $ Y-to-Y Growth Rate
- 5.4%
2.5%
- 3.1%
- 0.8%
0.9% 1.5% 2015 Study FY 2011 FY 2012 FY 2013 FY 2014 FY 2015 FY 2016 FY 2017 FY 2018 FY 2019 FY 2020 Twin River VLTs 442.4 $
476.0 $ 472.6 $
462.4 $
460.1 $ 457.8 $ 455.5 $ 453.2 $ 450.9 $ 448.7 $
Y-to-Y Growth Rate 7.6%
- 0.7%
- 2.2%
- 0.5%
- 0.5%
- 0.5%
- 0.5%
- 0.5%
- 0.5%
Twin River Tables 1.9 $ 88.1 $ 114.5 $ 125.6 $ 127.5 $ 129.4 $ 131.3 $ 133.3 $ Y-to-Y Growth Rate 30.0% 9.7% 1.5% 1.5% 1.5% 1.5% Newport Grand VLTs 50.2 $ 51.4 $ 48.1 $ 44.7 $ 44.0 $ 43.1 $ 42.3 $ 41.4 $ 40.6 $ 39.8 $ Y-to-Y Growth Rate 2.3%
- 6.3%
- 7.2%
- 1.5%
- 2.0%
- 1.9%
- 2.1%
- 1.9%
- 2.0%