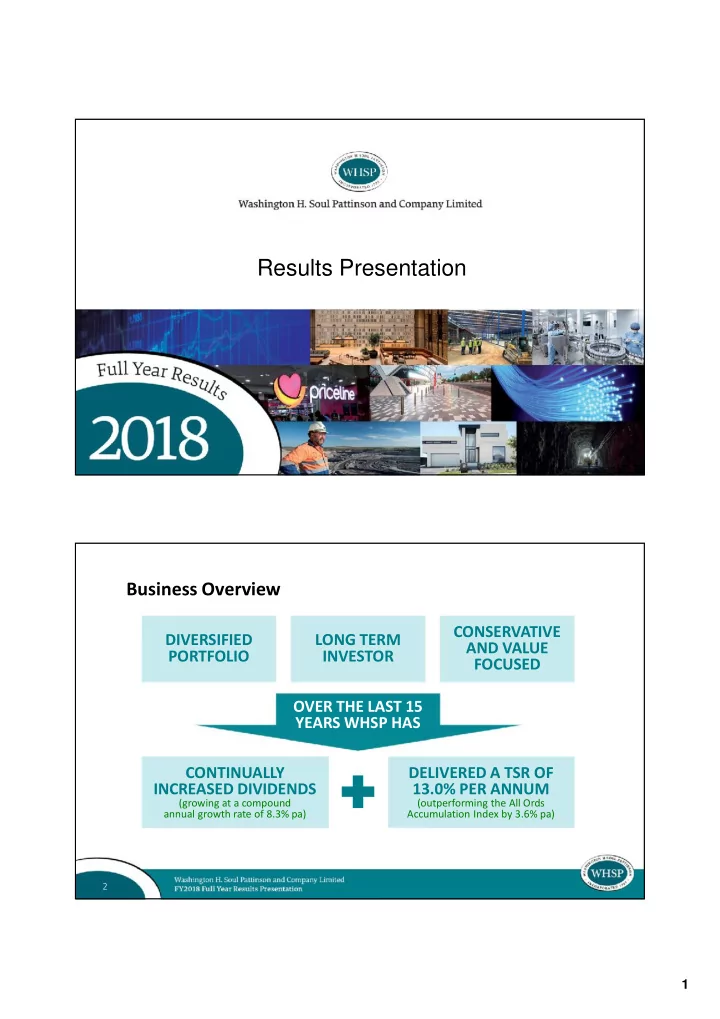
SLIDE 3 3
Portfolio Performance As at 31 July 2018
WHSP’s Holding % Value of Holding $m 12 month movement
TPG Telecom 25.3% 1,350 * 45) 3.5%) New Hope Corporation
(59.6% held 31 July 2017)
50.0% 1,326
*
533) 67.2%) Brickworks 43.9% 1,023 * 156) 18.0%) Financial Services Portfolio
5) 1.2%) API 19.3% 161 * (6) (3.7%) Round Oak Minerals
formerly CopperChem and Exco Resources
100% 154
^
71) 84.3%) Apex 30.3% 83 * 34) 70.0%) TPI Enterprises
(18.9% held 31 July 2017)
19.9% 21 * (20) (48.7%) Other Listed Equities Portfolio 515 * 68) 15.3%) Other Unlisted Equities Portfolio 93 ^ 21) 28.4%) Property Portfolio (net of borrowings) 183 ^ (25) (12.2%) Cash and other net assets 116 90) 354.9%) Net assets value (pre-tax) 5,439 972) 21.8%) 5 $1.1 billion tax payable if portfolio sold on 31 July 2018
* Market value ^ Directors’ valuations
Pre tax net asset value $5.4 billion or $22.72 per share Gross portfolio value increased 1.0 billion 21.8%
YTD Pre-tax Net Asset Value
Bridge between July and August 2018 (one month movement)
6
+ $675m + $20m $6,516m
Net Asset Value as at 31/8/18
+ $125m + $258m $5,439m
Net Asset Value as at 31/7/18
“other” +19.8%