SLIDE 1 Results Presentation and Company Profjle
as at 30 June 2020
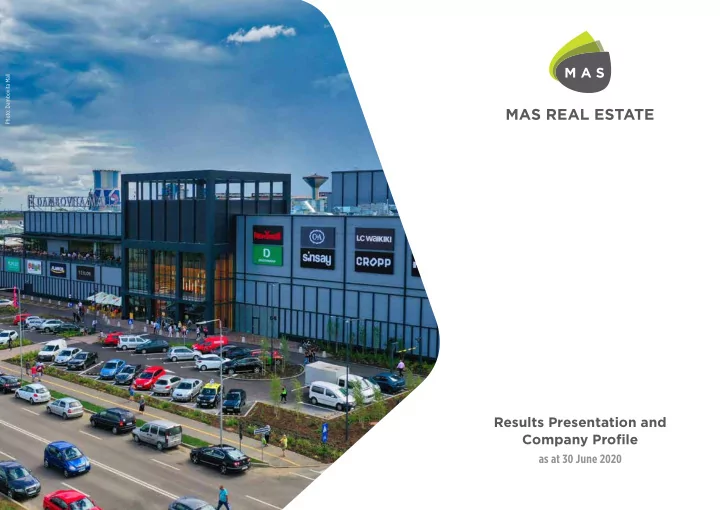
Photo: Dambovita Mall
SLIDE 2 2
TABLE OF CONTENTS
3 RESULTS SUMMARY 4 COVID–19 5 COLLECTION as at 27 Aug 20 6 EARNINGS Jan — Jun 20 7 NET ASSET VALUE Jun 20 8 EARNINGS Jan — Jun 20 vs. Jul — Dec 19 9 NET ASSET VALUE Jun 20 vs. Dec 19 10 CEE PASSING NET RENTAL INCOME & FAIR VALUE MOVEMENTS Jan — Jun 20 11 CEE DEVELOPMENT PROPERTY MOVEMENTS Jan — Jun 20 12 DEBT CAPACITY AND REPAYMENT PROFILE Jun 20 13 COMPANY PROFILE 14 EARNINGS Jun 18 — Jun 20 15 NET ASSET VALUE Jun 18 — Jun 20 16 INCOME PROPERTY SCHEDULE Jun 20 17 DEVELOPMENT PROPERTY SCHEDULE Jun 20 18 PORTFOLIO OVERVIEW 19 INCOME PROPERTY 29 DEVELOPMENT PROPERTY 39 BOARD OF DIRECTORS 42 DEVELOPMENT JOINT VENTURE STRUCTURE 43 BENEFICIAL SHAREHOLDERS HOLDING OVER 5% Jun 20 44 GLOSSARY
Note: All fjgures in this document are based on segmental fjnancial information (Note 3 in the consolidated annual fjnancial statements for the year ended 30 June 2020 — the 'IFRS fjnancial statements'), where the development joint venture ('DJV') is consolidated under the proportionate method, instead of the equity method. This information is intended to be a complement to, not a replacement of, MAS' (hereafter referred to as the Group or the Company) IFRS fjnancial statements.
SLIDE 3 3
BACK TO TOP
3.11 eurocents
Adjusted distributable earnings/share
107 eurocents
Tangible net asset value/share
Sales/m2 (LFL)*
Passing NRI (LFL)
+6.4%
Rent reversion
+1.3%
Indexation
93.1%
Occupancy
73.7%
Collection
11.9%
OCR*
Footfall (LFL)
RESULTS SUMMARY
FINANCIAL RESULTS CEE OPERATIONAL RESULTS
Jan – Jun 2020 vs. Jan – Jun 2019 Jun 2020 vs. Dec 2019 HIGHLIGHTS
Delisting from Luxembourg Stock Exchange Measures to safely reopen shopping centres after Covid-19 lockdowns FlexAssist solidarity program launch Savings on corporate expenses by rationalising Isle of Man office Share purchase by DJV Reducing REIT portfolio by selling down illiquid positions Disposal of WE properties Restructuring of corporate and relocation of functions Mitigating the impact of Covid-19
Jan – Jun 2020 Jan – Jun 2020 vs. Jan – Jun 2019 Jun 2020 Jan – Jun 2020 Jun 2020 * To improve comparison between properties and other market data, the following categories of tenants have been excluded from calculations: supermarkets, DIYs, entertainment and services. Jan – Jun 2020 Jul 2019 – Jun 2020 Jan – Jun 2020 vs. Jan – Jun 2019
SLIDE 4 4
BACK TO TOP
MAIN IMPACT
Disruption in operations CEE: all non-essential retailers’ operations closed UK hospitality and retail assets severely affected German retail assets have a high concentration of essential tenants and suffered less severe damage Office, logistics and industrial assets currently not materially affected Polish legislation enforced tenant rent and service charge holiday All tenants re-opened for trade (excluding Romanian indoor food & beverage and leisure) by July 2020
INITIAL RESPONSE
Contingency plans implemented by 31 March IT frameworks enabling telecommuting Operational cost reductions minimising impact
- n tenants during mall closures
Draw-down of all available bank facilities to mitigate potential negative impact on the financial system Preparation for suspension of all non- essential/un-committed developments and extensions, as well as other non-essential capital expenditure and investments Plans to limit disruption for ongoing developments Non-essential retail tenants’ invoicing suspended
ONGOING MEASURES
Re-opening shopping centres Discounts, or conditional rental holidays, for severely affected Romanian and Bulgarian retail tenants Outdoor food courts’ seating solutions implemented, integrated with food operators Network of drive-in and outdoor cinemas designed, permitted and rolled out by the DJV Thermometers and hand sanitising stations installed Free disposable face masks provided for shoppers Ongoing tenant support where required Residential sales support Deposit security Flexassist solidarity program launched
COVID–19
SLIDE 5 5
BACK TO TOP
COLLECTION as at 27 Aug 20
8.0 8.0 8.0 0.0 0.0 0.0 1.0 1.0 1.0 2.0 2.0 2.0 3.0 3.0 3.0 4.0 4.0 4.0 5.0 5.0 5.0 6.0 6.0 6.0 7.0 7.0 7.0
Collected Due Waived or deferred Collected Due Waived or deferred Collected Due Waived or deferred Group Collection — Total Income €m WE Collection — Total Income €m CEE Collection — Total Income €m
Jan 20 Jan 20 Jan 20 Feb 20 Feb 20 Feb 20 Mar 20 Mar 20 Mar 20 Apr 20 Apr 20 Apr 20 May 20 May 20 May 20 Jun 20 Jun 20 Jun 20 Jul 20 Jul 20 Jul 20
80.5%
Collection
73.7%
Collection
89.8%
Collection Jan–Jun 2020 Jan–Jun 2020 Jan–Jun 2020
6.6 6.6 5.8 3.4 3.8 3.8 3.1 0.8 1.5 2.8 2.8 2.7 1.9 2.5 2.5 2.6 2.0 0.4 0.5 0.1 0.1 0.8 0.7 2.1 1.2 0.3 0.1 2.8 2.9 0.9 2.5 0.8 0.7 4.6 5.3 5.5 1.0 0.9 1.3 0.4 0.1 0.1 0.2 0.1 0.5 0.5 0.1 0.1 0.2 0.2 0.2
SLIDE 6 6
BACK TO TOP
EARNINGS Jan — Jun 20
Proportionate accounts Six months ended 30 Jun 2020 Adjustments Six months ended 30 Jun 2020 Adjusted proportionate accounts Six months ended 30 Jun 2020 Total CEE DJV WE Co Total CEE DJV WE Co Total CEE DJV WE Co EARNINGS (74,182) (27,787) 2,423 (1,225) (47,593) (11,353) 4,698 429 (16,617) 137 (85,535) (23,089) 2,852 (17,842) (47,456) Distributable earnings 24,790 9,956 6,313 9,347 (826) (2,918) – – – (2,918) 21,872 9,956 6,313 9,347 (3,744) Net rental income – income property 27,241 12,671 1,436 13,134 – – – – – – 27,241 12,671 1,436 13,134 – Net income – preference shares 3,930 – 3,930 – – – – – – – 3,930 – 3,930 – – Net dividends – listed securities 1 2,300 – – – 2,300 (2,918) – – – (2,918) (618) – – – (618) Net corporate expenses (2,599) (208) (71) (419) (1,901) – – – – – (2,599) (208) (71) (419) (1,901) Interest on debt fjnancing (6,849) (2,065) (325) (3,107) (1,352) – – – – – (6,849) (2,065) (325) (3,107) (1,352) Interest capitalised on developments 1,435 – 1,435 – – – – – – – 1,435 – 1,435 – – Other distributable net income/(cost) (240) (473) (53) (12) 298 – – – – – (240) (473) (53) (12) 298 Income tax (428) 31 (39) (249) (171) – – – – – (428) 31 (39) (249) (171) Non-distributable earnings (98,972) (37,743) (3,890) (10,572) (46,767) (8,435) 4,698 429 (16,617) 3,055 (107,407) (33,045) (3,461) (27,189) (43,712) Fair value adjustments – income property (44,078) (32,398) (3,300) (8,380) – – – – – – (44,078) (32,398) (3,300) (8,380) – Fair value adjustments – interest rate derivatives (2,738) (725) – (2,013) – – – – – – (2,738) (725) – (2,013) – Fair value adjustments – listed securities 1 (39,115) – – – (39,115) 2,918 – – – 2,918 (36,197) – – – (36,197) Fair value adjustments – other fjnancial liabilities (1,694) (2,058) – 364 – 2,058 2,058 – – – 364 – – 364 – Foreign currency exchange difgerences (5,489) 188 1 – (5,678) – – – – – (5,489) 188 1 – (5,678) Goodwill impairment 2 (6,826) (6,826) – – – 6,826 6,826 – – – – – – – – Investment expenses (2,282) (110) (10) (454) (1,708) – – – – – (2,282) (110) (10) (454) (1,708) Share-based payment expense 3 (493) (356) – – (137) 493 356 – – 137 – – – – – Other non-distributable income/(cost) (281) – (152) – (129) – – – – – (281) – (152) – (129) Tax on sale of property (61) – – (61) – – – – – – (61) – – (61) – Deferred tax 4 4,085 4,542 (429) (28) – (4,113) (4,542) 429 – – (28) – – (28) – Estimation for WE disposal realisation costs and losses 5 – – – – – (16,617) – – (16,617) – (16,617) – – (16,617) – Weighted average number of shares (m) 6 703.3 Adjusted distributable earnings per share (eurocents) 3.11
1 – 6
Please see Glossary. All amounts in € thousand unless otherwise stated.
SLIDE 7 7
BACK TO TOP
Proportionate accounts 30 Jun 2020 Adjustments 30 Jun 2020 Adjusted proportionate accounts 30 Jun 2020 Total CEE DJV WE Co Total CEE DJV WE Co Total CEE DJV WE Co NET ASSET VALUE 796,023 299,283 212,729 282,400 1,611 (52,369) 4,132 (3,811) (52,690) – 743,654 303,415 208,918 229,710 1,611 Assets 1,317,243 473,178 229,818 543,505 70,742 (23,369) (15,396) (7,973) – – 1,293,874 457,782 221,845 543,505 70,742 Income property 1,007,451 435,699 45,116 526,636 – – – – – – 1,007,451 435,699 45,116 526,636 – Developments – income property 41,682 907 40,775 – – – – – – – 41,682 907 40,775 – – Developments – residential property 15,322 – 15,322 – – – – – – – 15,322 – 15,322 – – Preference shares 111,630 – 111,630 – – – – – – – 111,630 – 111,630 – – Listed securities 6 43,469 – 7,973 – 35,496 (7,973) – (7,973) – – 35,496 – – – 35,496 Goodwill 2 1,696 1,696 – – – (1,696) (1,696) – – – – – – – – Deferred tax asset 3,519 2,218 125 1,176 – – – – – – 3,519 2,218 125 1,176 – Interest rate derivative fjnancial assets – – – – – – – – – – – – – – – Other assets 1,756 464 289 783 220 – – – – – 1,756 464 289 783 220 VAT receivable 4,465 2 4,028 347 88 – – – – – 4,465 2 4,028 347 88 Share-based payment prepayments 3 13,700 13,700 – – – (13,700) (13,700) – – – – – – – – Trade and other receivables 17,768 8,914 1,179 7,366 309 – – – – – 17,768 8,914 1,179 7,366 309 Cash and cash equivalents 54,785 9,578 3,381 7,197 34,629 – – – – – 54,785 9,578 3,381 7,197 34,629 Liabilities 521,220 173,895 17,089 261,105 69,131 29,000 (19,528) (4,162) 52,690 – 550,220 154,367 12,927 313,795 69,131 Debt fjnancing 456,484 143,166 4,646 241,999 66,673 – – – – – 456,484 143,166 4,646 241,999 66,673 Interest rate derivative fjnancial liabilities 4,175 1,930 – 2,245 – – – – – – 4,175 1,930 – 2,245 – Other liabilities 1,349 – 1,054 295 – – – – – – 1,349 – 1,054 295 – Deferred tax liability 4 31,586 19,528 4,162 7,896 – (23,690) (19,528) (4,162) – – 7,896 – – 7,896 – Trade and other payables 27,626 9,271 7,227 8,670 2,458 – – – – – 27,626 9,271 7,227 8,670 2,458 Estimation for WE disposal realisation costs and losses 5 – – – – – 52,690 – – 52,690 – 52,690 – – 52,690 – Closing number of shares in issue (m) 6 692.5 Net asset value per share (eurocents) 115 43 31 41 – Tangible net asset value per share (eurocents) 107 44 30 33 –
NET ASSET VALUE Jun 20
1 – 6
Please see Glossary. All amounts in € thousand unless otherwise stated.
SLIDE 8 8
BACK TO TOP
EARNINGS Jan — Jun 20 vs. Jul — Dec 19
Adjusted proportionate accounts Six months ended 30 Jun 2020 Adjusted proportionate accounts Six months ended 31 Dec 2019 Δ Total CEE DJV WE Co Total CEE DJV WE Co Total CEE DJV WE Co EARNINGS (85,535) (23,089) 2,852 (17,842) (47,456) 46,542 39,646 17,185 (27,401) 17,112 (132,077) (62,735) (14,333) 9,559 (64,568) Distributable earnings 21,872 9,956 6,313 9,347 (3,744) 27,550 12,680 4,920 8,691 1,259 (5,678) (2,724) 1,393 656 (5,003) Net rental income – income property 27,241 12,671 1,436 13,134 – 28,643 14,899 885 12,859 – (1,402) (2,228) 551 275 – Net income – preference shares 3,930 – 3,930 – – 3,950 – 3,950 – – (20) – (20) – – Net dividends – listed securities 1 (618) – – – (618) 3,714 – – – 3,714 (4,332) – – – (4,332) Net corporate expenses (2,599) (208) (71) (419) (1,901) (3,377) (344) (120) (333) (2,580) 778 136 49 (86) 679 Interest on debt fjnancing (6,849) (2,065) (325) (3,107) (1,352) (5,819) (1,630) (477) (3,256) (456) (1,030) (435) 152 149 (896) Interest capitalised on developments 6 1,435 – 1,435 – – 738 – 738 – – 697 – 697 – – Other distributable net income/(cost) (240) (473) (53) (12) 298 545 (15) (27) 4 583 (785) (458) (26) (16) (285) Income tax (428) 31 (39) (249) (171) (844) (230) (29) (583) (2) 416 261 (10) 334 (169) Non–distributable earnings (107,407) (33,045) (3,461) (27,189) (43,712) 18,992 26,966 12,265 (36,092) 15,853 (126,399) (60,011) (15,726) 8,903 (59,565) Fair value adjustments – income property (44,078) (32,398) (3,300) (8,380) – 42,023 27,338 12,423 2,262 – (86,101) (59,736) (15,723) (10,642) – Fair value adjustments – interest rate derivatives (2,738) (725) – (2,013) – 439 507 – (68) – (3,177) (1,232) – (1,945) – Fair value adjustments – listed securities 1 (36,197) – – – (36,197) 12,227 – – – 12,227 (48,424) – – – (48,424) Fair value adjustments – other fjnancial liabilities 364 – – 364 – (171) – (265) 94 – 535 – 265 270 – Foreign currency exchange difgerences – indirect (5,489) 188 1 – (5,678) 4,554 (188) – – 4,742 (10,043) 376 1 – (10,420) Goodwill impairment 2 – – – – – – – – – – – – – – – Investment expenses (2,282) (110) (10) (454) (1,708) (1,990) (691) (34) (149) (1,116) (292) 581 24 (305) (592) Share-based payment expense 3 – – – – – – – – – – – – – – – Other non-distributable income/(cost) (281) – (152) – (129) 141 – 141 – – (422) – (293) – (129) Tax on sale of property (61) – – (61) – – – – – – (61) – – (61) – Deferred tax 4 (28) – – (28) – (2,158) – – (2,158) – 2,130 – – 2,130 – Estimation for WE disposal realisation costs and losses 5 (16,617) – – (16,617) – (36,073) – – (36,073) – 19,456 – – 19,456 – Weighted average number of shares (m) 6 703.3 649.9 Adjusted distributable earnings per share (eurocents) 3.11 4.24 Dividend per share (eurocents) 4.24
1 – 6
Please see Glossary. All amounts in € thousand unless otherwise stated.
SLIDE 9 9
BACK TO TOP
Adjusted proportionate accounts 30 Jun 2020 Adjusted proportionate accounts 31 Dec 2019 Δ Total CEE DJV WE Co Total CEE DJV WE Co Total CEE DJV WE Co NET ASSET VALUE 743,654 303,415 208,918 229,710 1,611 874,810 344,706 175,433 261,978 92,693 (131,156) (41,291) 33,485 (32,268) (91,082) Assets 1,293,874 457,782 221,845 543,505 70,742 1,437,518 499,645 206,174 565,630 166,069 (143,644) (41,863) 15,671 (22,125) (95,327) Income property 1,007,451 435,699 45,116 526,636 – 1,043,146 467,375 48,452 527,319 – (35,695) (31,676) (3,336) (683) – Developments – income property 41,682 907 40,775 – – 47,673 331 30,608 16,734 – (5,991) 576 10,167 (16,734) – Developments – residential property 15,322 – 15,322 – – 12,555 – 12,555 – – 2,767 – 2,767 – – Preference shares 111,630 – 111,630 – – 105,577 – 105,577 – – 6,053 – 6,053 – – Listed securities 6 35,496 – – – 35,496 131,350 – – – 131,350 (95,854) – – – (95,854) Goodwill 2 – – – – – – – – – – – – – – – Deferred tax asset 3,519 2,218 125 1,176 – 4,316 3,208 549 559 – (797) (990) (424) 617 – Interest rate derivative fjnancial assets – – – – – 702 – – 702 – (702) – – (702) – Other assets 1,756 464 289 783 220 1,484 57 508 – 919 272 407 (219) 783 (699) VAT receivable 4,465 2 4,028 347 88 4,820 92 3,923 637 168 (355) (90) 105 (290) (80) Share-based payment prepayments – – – – – – – – – – – – – – – Trade and other receivables 17,768 8,914 1,179 7,366 309 17,294 9,667 492 6,746 389 474 (753) 687 620 (80) Cash and cash equivalents 54,785 9,578 3,381 7,197 34,629 68,601 18,915 3,510 12,933 33,243 (13,816) (9,337) (129) (5,736) 1,386 Liabilities 550,220 154,367 12,927 313,795 69,131 562,708 154,939 30,741 303,652 73,376 (12,488) (572) (17,814) 10,143 (4,245) Debt fjnancing 456,484 143,166 4,646 241,999 66,673 485,266 142,207 22,032 248,644 72,383 (28,782) 959 (17,386) (6,645) (5,710) Interest rate derivative fjnancial liabilities 4,175 1,930 – 2,245 – 2,157 1,205 – 952 – 2,018 725 – 1,293 – Other liabilities 1,349 – 1,054 295 – 693 – – 693 – 656 – 1,054 (398) – Deferred tax liability 4 7,896 – – 7,896 – 7,207 – – 7,207 – 689 – – 689 – Trade and other payables 27,626 9,271 7,227 8,670 2,458 31,312 11,527 8,709 10,083 993 (3,686) (2,256) (1,482) (1,413) 1,465 Estimation for WE disposal realisation costs and losses 5 52,690 – – 52,690 – 36,073 – – 36,073 – 16,617 – – 16,617 – Closing number of shares in issue (m) 6 692.5 704.5 Tangible net asset value per share (eurocents) 107 44 30 33 – 124 49 25 37 13
NET ASSET VALUE Jun 20 vs. Dec 19
1 – 6
Please see Glossary. All amounts in € thousand unless otherwise stated.
SLIDE 10 10
BACK TO TOP
CEE PASSING NET RENTAL INCOME & FAIR VALUE MOVEMENTS Jan — Jun 20
CEE Passing Net Rental Income movements Developments and acquisitions completed during the period CEE Income Property Fair Value movements Passing NRI at 31 Dec 19 €38.3m €515.8m €(0.7)m €3.2m €(38.1)m €37.6m €480.9m Income property at 31 Dec 19 Passing NRI – LFL portfolio Capitalised costs – income properties Valuation losses – income properties Passing NRI at 30 Jun 20 Income property at 30 Jun 20
Dec 19 Jun 20 Aug 20
Dambovita Mall
DCF VALUATION ASSUMPTIONS Range Discount rates (unlevered) 9.77 — 11.16% ERV long-term growth rate 2.5 — 3.25% Capex reserve (% of ERV) 5 — 10% Vacancy (long-term) 1.5 — 3.5% Collection loss (long-term) 0 — 1% Leasing fees on renewal (% 1st year ERV) 8.3 — 12.5% Void at expiry 3 — 5 months Reinstatement/fit-out cost on re-leasing 40 — 100 €/m2 Note: All amounts are calculated on a proportionate basis.
SLIDE 11 11
BACK TO TOP
CEE DEVELOPMENT PROPERTY MOVEMENTS Jan — Jun 20
Development pipeline at 31 Dec 19 €423.3m €(7.4)m €9.4m €425.3m Pipeline budget variances New developments Development pipeline at 30 Jun 20
Dambovita Mall completed in Aug 20 Dambovita Mall completed in Aug 20
Note: All amounts are calculated on a proportionate basis.
SLIDE 12 12
BACK TO TOP
DEBT CAPACITY AND REPAYMENT PROFILE Jun 20
Debt 30 Jun 2020 Cash Net debt (debt-cash) Maximum net debt capacity (40% LTV; 7xNRI) €456.5m €54.8 €401.7 €445.2m €(21.0)m €(160.1)m €(50.9)m €(110.2)m €(40.7)m €(27.5)m €(20.7)m €(2.2)m €(22.9)m €(0.3)m 2021 repayment 2022 2023 2024 2025 2026 2027 2028 2029 2030 Note: All amounts are calculated on a proportionate basis. As at 30 June 2020 both headroom (computed as debt capacity less drawn facilities) and undrawn secured facilities amount to nil.
33%
LTV
6.3
ND/NRI
4.3
NRI/INT
3.28%
WACD
SLIDE 13 13
BACK TO TOP
COMPANY PROFILE
INTERNALLY MANAGED PROPERTY INVESTOR AND OPERATOR FOCUSED ON RETAIL PROPERTIES IN CEE
Capital currently invested in WE will be redeployed directly into income property in CEE and indirectly, on a downside protected basis, into developments via further preference shares in the DJV with co-investor, developer and general contractor Prime Kapital. The Group is operated by a multidisciplinary team of 200 professionals that combine investment, acquisition, leasing, asset and property management, marketing and fjnance
- skills. When required, development and construction skills
can be provided by joint venture partner Prime Kapital.
MAXIMUM PORTFOLIO LTV OF 40% OR 7 X NRI
Overall net debt to be limited to a maximum of 40% of current income property value, or seven-times forward-looking net rental income. All fjgures calculated on a proportionate basis.
LISTED ON THE MAIN BOARD OF THE JSE
MAS concluded the de-listing from the Euro-MTF market
- f the Luxembourg Stock Exchange.
PASSING NET RENTAL INCOME
53% CEE direct portfolio €34.0m 6% CEE DJV €3.6m 41% WE direct portfolio €26.0m
BOOK VALUE
43% CEE direct portfolio €435.7m 4% CEE DJV €45.2m 53% WE direct portfolio €526.8m
54+6+42+S 44+4+54+S
SLIDE 14 14
BACK TO TOP
EARNINGS Jun 18 — Jun 20
Adjusted proportionate accounts 2018 Adjusted proportionate accounts 2019 Adjusted proportionate accounts 2020 Total CEE DJV WE Co Total CEE DJV WE Co Total CEE DJV WE Co EARNINGS 22,135 14,454 13,111 7,309 (12,739) 63,120 40,326 23,057 26,784 (27,047) (38,993) 16,557 20,037 (45,243) (30,344) Distributable earnings 30,274 8,132 5,638 14,818 1,686 50,522 18,543 9,552 18,170 4,257 49,422 22,636 11,233 18,038 (2,485) Net rental income – income property 30,848 10,198 903 19,747 – 48,968 21,541 2,207 25,220 – 55,884 27,570 2,321 25,993 – Net income – preference shares 4,509 – 4,509 – – 6,717 – 6,717 – – 7,880 – 7,880 – – Net dividends – listed securities 1 3,969 – – – 3,969 7,361 – – – 7,361 3,096 – – – 3,096 Net corporate expenses (4,364) (523) (288) (517) (3,036) (5,594) (714) (185) (562) (4,133) (5,976) (552) (191) (752) (4,481) Interest on debt fjnancing (4,985) (1,399) – (3,586) – (8,471) (1,956) (499) (5,692) (324) (12,668) (3,695) (802) (6,363) (1,808) Interest capitalised on developments 514 – 514 – – 1,882 – 1,462 420 – 2,173 – 2,173 – – Other distributable net income/(cost) 455 (18) 30 (310) 753 1,212 83 (110) (114) 1,353 305 (488) (80) (8) 881 Income tax (672) (126) (30) (516) – (1,553) (411) (40) (1,102) – (1,272) (199) (68) (832) (173) Non–distributable earnings (8,139) 6,322 7,473 (7,509) (14,425) 12,598 21,783 13,505 8,614 (31,304) (88,415) (6,079) 8,804 (63,281) (27,859) Fair value adjustments – income property 13,000 7,496 8,513 (3,009) – 53,048 23,877 13,558 15,613 – (2,055) (5,060) 9,123 (6,118) – Fair value adjustments – interest rate derivatives 289 (249) – 538 – (751) (1,161) – 410 – (2,299) (218) – (2,081) – Fair value adjustments – listed securities 1 (14,425) – – – (14,425) (31,304) – – – (31,304) (23,970) – – – (23,970) Fair value adjustments – other fjnancial liabilities (1,567) – – (1,567) – (1,589) – 200 (1,789) – 193 – (265) 458 – Foreign currency exchange difgerences (1,020) – – (1,020) – (365) – – (365) – (935) – 1 – (936) Goodwill impairment 2 – – – – – – – – – – – – – – – Investment expenses (2,785) (925) (1,040) (820) – (3,230) (933) (253) (2,044) – (4,272) (801) (44) (603) (2,824) Share-based payment expense 3 – – – – – – – – – – – – – – – Other non-distributable income/(cost) – – – – – 18 – – 18 – (140) – (11) – (129) Tax on sale of property (2,576) – – (2,576) – (1,546) – – (1,546) – (61) – – (61) – Deferred tax 4 945 – – 945 – (1,683) – – (1,683) – (2,186) – – (2,186) – Estimation for WE disposal realisation costs and losses 5 – – – – – – – – – – (52,690) – – (52,690) – Adjusted distributable earnings per share (eurocents) 5.24 7.93 7.35 Dividend per share (eurocents) 7.61 8.75 4.24
1 – 6
Please see Glossary. All amounts in € thousand unless otherwise stated.
SLIDE 15 15
BACK TO TOP
NET ASSET VALUE Jun 18 — Jun 20
Adjusted proportionate accounts 30 Jun 2018 Adjusted proportionate accounts 30 Jun 2019 Adjusted proportionate accounts 30 Jun 2020 Total CEE DJV WE Co Total CEE DJV WE Co Total CEE DJV WE Co NET ASSET VALUE 835,648 99,756 130,276 284,004 321,612 847,420 272,490 123,781 291,094 160,055 743,654 303,415 208,918 229,710 1,611 Assets 1,127,504 143,603 134,136 528,153 321,612 1,331,960 371,098 163,899 577,350 219,613 1,293,874 457,782 221,845 543,505 70,742 Income property 579,454 132,800 23,888 422,766 – 850,324 349,944 13,880 486,500 – 1,007,451 435,699 45,116 526,636 – Developments – income property 71,993 – 26,665 45,328 – 73,762 273 27,818 45,671 – 41,682 907 40,775 – – Developments – residential property 8,243 – 8,243 – – 9,790 – 9,790 – – 15,322 – 15,322 – – Preference shares 63,027 – 63,027 – – 104,477 – 104,477 – – 111,630 – 111,630 – – Listed securities 6 183,052 – – – 183,052 147,372 – – – 147,372 35,496 – – – 35,496 Goodwill 2 – – – – – – – – – – – – – – – Deferred tax asset 607 – – 607 – 4,773 2,411 1,096 1,266 – 3,519 2,218 125 1,176 – Interest rate derivative fjnancial assets 349 – – 349 – 775 – – 775 – – – – – – Other assets 47,229 204 89 25,037 21,899 50,183 50 204 12,456 37,473 1,756 464 289 783 220 VAT receivable 1,932 30 798 1,104 – 2,819 916 855 1,048 – 4,465 2 4,028 347 88 Share-based payment prepayments – – – – – – – – – – – – – – – Trade and other receivables 15,129 2,038 630 12,461 – 14,293 6,442 776 6,790 285 17,768 8,914 1,179 7,366 309 Cash and cash equivalents 156,489 8,531 10,796 20,501 116,661 73,392 11,062 5,003 22,844 34,483 54,785 9,578 3,381 7,197 34,629 Liabilities 291,856 43,847 3,860 244,149 – 484,540 98,608 40,118 286,256 59,558 550,220 154,367 12,927 313,795 69,131 Debt fjnancing 233,719 40,277 – 193,442 – 439,347 87,535 36,704 255,550 59,558 456,484 143,166 4,646 241,999 66,673 Interest rate derivative fjnancial liabilities 1,161 249 – 912 – 2,383 1,410 – 973 – 4,175 1,930 – 2,245 – Other liabilities 36,759 521 415 35,823 – 17,220 1,935 284 15,001 – 1,349 – 1,054 295 – Deferred tax liability 4 3,368 – – 3,368 – 5,723 – – 5,723 – 7,896 – – 7,896 – Trade and other payables 16,849 2,800 3,445 10,604 – 19,867 7,728 3,130 9,009 – 27,626 9,271 7,227 8,670 2,458 Estimation for WE disposal realisation costs and losses 5 – – – – – – – – – – 52,690 – – 52,690 – Closing number of shares in issue (m) 6 637.5 637.5 692.5 Tangible net asset value per share (eurocents) 131 16 20 45 50 133 43 19 46 25 107 44 30 33 –
1 – 6
Please see Glossary. All amounts in € thousand unless otherwise stated.
SLIDE 16 16
BACK TO TOP
INCOME PROPERTY SCHEDULE Jun 20
Destination Asset MAS' share Location Type Acq/Dev Stake Acquired GLA GLA Occup. NRI BV Cost NRI BV Cost NRI/BV NRI/Cost % year m 2 m 2 % €m €m €m €m €m €m % % INCOME PROPERTY 727,100 95.6% 69.0 1,075.3 1,009.1 63.6 1,007.7 956.3 6.8% 7.3% CEE – income property 460,500 319,000 93.1% 43.0 548.5 471.2 37.6 480.9 418.4 7.9% 9.0% CEE – direct income property 343,000 243,100 92.7% 34.0 435.7 383.1 34.0 435.7 383.1 7.9% 8.9% Militari Shopping RO, Bucharest Regional A 100% 2018 67,900 54,000 98.7% 7.9 104.3 96.8 7.9 104.3 96.8 7.6% 8.2% Galleria Burgas BG, Burgas Regional A 100% 2017 64,100 36,300 90.1% 6.0 72.6 45.8 6.0 72.6 45.8 8.3% 13.2% Nova Park PL, Gorzow Regional A 100% 2016 38,500 32,400 85.0% 5.9 82.3 90.1 5.9 82.3 90.1 7.2% 6.5% Atrium Mall RO, Arad Regional A 100% 2018 30,500 28,400 85.5% 4.4 54.9 37.9 4.4 54.9 37.9 8.0% 11.7% Kaufmand centres RO, Various Convenience A/D 100% 2019 55,700 27,800 96.9% 2.9 37.0 34.6 2.9 37.0 34.6 8.0% 8.5% Baia Mare Value Centre RO, Baia Mare Community A/D 100% 2019 42,000 21,300 95.7% 2.5 31.6 29.1 2.5 31.6 29.1 8.1% 8.8% Roman Value Centre RO, Roman Community A/D 100% 2019 18,800 18,800 98.4% 2.5 33.1 27.7 2.5 33.1 27.7 7.7% 9.2% Galleria Stara Zagora BG, Stara Zagora Regional A 100% 2017 25,500 24,100 90.1% 1.9 19.9 21.1 1.9 19.9 21.1 9.4% 8.9% CEE – DJV income property 117,500 75,900 94.4% 9.0 112.8 88.1 3.6 45.2 35.3 8.0% 10.2% DN1 Value Centre RO, Balotesti Community D 40% 2019 46,700 27,000 94.4% 3.7 49.0 35.9 1.5 19.6 14.4 7.6% 10.4% Mall Moldova – Phase I RO, Iasi Regional A 40% 2017 47,300 29,600 93.6% 2.8 33.4 32.0 1.1 13.4 12.8 8.4% 8.7% Zalau Value Centre RO, Zalau Community D 40% 2019 23,300 19,300 95.7% 2.5 30.4 20.2 1.0 12.2 8.1 8.1% 12.2% WE – income property and land bank (held for sale) 408,100 97.5% 26.0 526.8 537.9 26.0 526.8 537.9 5.8% 5.8% Edeka portfolio DE, Various Convenience A 100% 2016 73,000 98.7% 5.4 91.0 91.5 5.4 91.0 91.5 5.9% 5.9% New Uberior House UK, Edinburgh Offjce A 100% 2018 14,700 100% 4.7 82.4 83.0 4.7 82.4 83.0 5.7% 5.7% DIY portfolio DE, Various DIY A 100% 2014-15 43,000 100% 3.4 50.6 50.4 3.4 50.6 50.4 6.7% 6.7% Retail portfolio DE, Various Neighbourhood A 100% 2015-18 35,800 99.0% 3.0 57.2 54.4 3.0 57.2 54.4 5.3% 5.5% Flensburg Galerie DE, Flensburg Community A 100% 2019 22,600 78.5% 2.8 67.3 68.1 2.8 67.3 68.1 4.1% 4.0% Industrial portfolio UK, Various Industrial A 100% 2012-14 55,500 98.8% 2.7 32.2 38.4 2.7 32.2 38.4 8.2% 6.9% Adagio, retail and arches UK, Edinburgh Mixed D 100% 2016 9,000 96.9% 2.0 33.1 37.1 2.0 33.1 37.1 5.9% 5.3% Zurich CH, Buchs Industrial A 100% 2009 5,700 100% 1.4 25.1 17.4 1.4 25.1 17.4 5.6% 8.0% Bruchsal DE, Bruchsal Neighbourhood A 100% 2015 7,100 100% 1.3 22.6 22.0 1.3 22.6 22.0 5.7% 5.8% Gotha DE, Gotha Neighbourhood A 100% 2015 9,400 100% 0.9 11.1 12.5 0.9 11.1 12.5 7.9% 7.0% Munich DE, Munich Industrial A 100% 2016 13,100 100% 0.9 16.5 11.6 0.9 16.5 11.6 5.3% 7.5% Lewes NSQ UK, Lewes Land A 100% 2011 89,200 16.2 26.9 16.2 26.9 Langley Park UK, Chippenham Land A 100% 2014 23,800 15.8 20.6 15.8 20.6 New Waverley UK, Edinburgh Land A 100% 2011 6,200 5.7 4.0 5.7 4.0 Other property management costs 100% (2.5) (2.5) BV: book value as per valuation reports. Cost: acquisition costs, including transaction & transfer fees, plus all costs capitalised post acquisition, except for interest. NRI: passing rental income less non-recoverable property related expenses. A/D: 60% acquired, 40% developed. GLA: rounded to the nearest hundred m2.
SLIDE 17 17
BACK TO TOP
DEVELOPMENT PROPERTY SCHEDULE Jun 20
Destination Asset MAS' share Location Type Status Stake Compl. GLA GLA/GSA ERV Units Spent Budget ERV Spent Budget Margin ERV/Budget % year m 2 m 2 €m # €m €m €m €m €m % % DEVELOPMENT PROPERTY 640,200 57.0 2,805 131.3 892.2 27.8 53.1 425.3 28.8% 8.7% Developments – income property 389,300 57.0 92.9 630.2 27.8 37.7 320.5 8.7% CEE – direct developments 213,600 43,100 8.0 0.9 114.1 8.0 0.9 114.1 7.1% Militari Shopping – extension RO, Bucharest Regional On hold 100% TBD 94,000 26,100 4.9 – 59.8 4.9 – 59.8 8.2% Galleria Burgas – extension BG, Burgas Regional On hold 100% TBD 78,000 13,900 2.3 0.2 43.0 2.3 0.2 43.0 5.3% Nova Park – extension PL, Gorzow Regional On hold 100% TBD 41,600 3,100 0.8 0.7 11.3 0.8 0.7 11.3 7.5% CEE – DJV developments 598,800 346,200 49.0 92.0 516.1 19.8 36.8 206.4 9.6% Dambovita Mall RO, Targoviste Regional Completed 40% 2020 31,200 31,200 4.4 42.8 45.7 1.8 17.1 18.3 9.7% Sepsi Value Centre RO, Sf. Gheorghe Community WIP 40% 2021 33,300 16,300 1.8 6.5 19.3 0.7 2.6 7.7 9.4% Mall Moldova – extension RO, Iasi Super-regional On hold 40% TBD 106,100 58,600 9.8 20.0 108.4 3.9 8.0 43.4 9.1% Arges Mall RO, Pitesti Regional Permitting 40% TBD 56,100 56,100 8.4 1.9 92.9 3.4 0.8 37.2 9.1% Prahova Value Centre RO, Ploiesti Community Permitting 40% 2021 28,800 20,800 2.5 1.2 28.1 1.0 0.5 11.2 9.0% Barlad Value Centre RO, Barlad Community Permitting 40% 2021 26,800 16,700 1.7 0.2 18.0 0.7 0.1 7.2 9.4% Baia Mare Value Centre – extension RO, Baia Mare Community Permitting 40% TBD 25,600 4,200 0.4 2.8 5.3 0.2 1.1 2.1 7.8% Roman Value Centre – extension RO, Roman Community Permitting 40% TBD 22,600 3,800 0.4 0.7 4.6 0.2 0.3 1.8 8.5% Slobozia Value Centre – extension RO, Slobozia Convenience Permitting 40% TBD 10,900 1,800 0.3 2.2 3.3 0.1 0.9 1.3 8.5% Alba Iulia Value Centre Ro, Alba Iulia Community Zoning 40% 2022 19,300 19,300 2.2 0.1 23.4 0.9 – 9.4 9.3% Adjud Value Centre RO, Adjud Convenience Zoning 40% TBD 6,300 3,700 0.4 0.3 3.5 0.2 0.1 1.4 10.1% Silk District RO, Iasi Offjce Permitting 40% 2023/26 231,800 113,700 16.7 4.3 163.6 6.7 1.7 65.4 10.2% Land RO Land 40% 9.0 3.6 Developments – residential property 250,900 2,805 38.4 262.0 15.4 104.8 28.8% Marmura Residence RO, Bucharest Residential WIP 40% 2021/22 36,100 459 18.4 41.7 7.4 16.7 28.5% Avalon Estate RO, Bucharest Residential Permitting 40% 2021/24 96,700 746 18.5 106.7 7.4 42.7 30.6% Silk District – Residential RO, Iasi Residential Permitting 40% 2022/27 118,100 1,600 1.5 113.6 0.6 45.4 27.3% Budget: includes land, hard & soft costs. Spent: Budget spent. GLA: gross leasable area, rounded to the nearest hundred m2. GSA: total gross sellable area, including residential and commercial and/or offjce spaces.
SLIDE 18 18 Bulgaria Romania Poland Germany United Kingdom
Warsaw Office Bucharest Office Sofia Office Isle of Man Office
Switzerland
Income properties
35
Developments, extensions and land bank
1 1 14 17 2 1 4 3
PORTFOLIO OVERVIEW
18
BACK TO TOP
SLIDE 19 19
BACK TO TOP
INCOME PROPERTY
MILITARI SHOPPING
54,000m²
GLA
€7.9m
NRI
€104.3m
BOOK VALUE
98.7%
OCCUPANCY
100%
OWNED BY MAS
Planned Extension
S A L A M A N D E R CATALI KIDS HAIRSTYLE E V A B E A U T Y PROFIHAIRSHOP D I N N E R
RAIMAR
I U T E P I Z Z A B O N I T A T A V A C U D E T O A T E A N A P A N R U S T I C LA BUFET
NORIEL
INMEDIO CLEAN SPOT SERVICES REMEDIA VERT L I L A R O S S A M I L A N O
A T M SILCA
BOUTIQUE 17 TABAC XPRESS MELI MELO COBI SMITH&SMITH SPLEND’OR GREGORY’S
SPORTISIMO
MUMUSO
COMPAS
DIGI K A L L O S LATIN GSM
E X C H A N G E T I C T A C ZERO SHARP
D&P
MOBICELL M O B I U P B I J O U X A R T INFINITY LOVE CHAUSSETTE ANTONIA FASHION ANTONIA FASHION FAN GSM CONTAKT CONSIG N A L A TONY GELATO S T E R O M A S I G U R A R I
× 3 , 8
Located in Militari, a densely populated and expanding residential district, this centre has excellent visibility and is located on Bucharest's main western artery, which links directly into the E81/A1 highway. The tenant mix includes a large hypermarket, DIY store, gym and high concentration of fashion and service anchors. The planned major extension and redevelopment of the centre is on hold due to Covid-19.
VISIT www.militari-shopping.ro
SLIDE 20 20
BACK TO TOP
GALLERIA BURGAS
Galleria Burgas is the dominant shopping centre in Burgas, the regional urban and administrative centre of the most popular holiday destination on the Bulgarian Black Sea coast. Footfall and tenant turnover has been increasing since opening, in
- 2012. The centre has a comprehensive
fashion offering well integrated with the leisure and food court area. A significant extension is on hold due to Covid-19.
36,300m²
GLA
€6.0m
NRI
€72.6m
BOOK VALUE
90.1%
OCCUPANCY
100%
OWNED BY MAS
INCOME PROPERTY
TERRANOVA
ART 98
P O W E R A N D B E A U T Y
E C C O
SEVEN SECONDS
TELENOR
LILLY
E N G L I S H H O M E D E N I X S U G A R W O R L D S U B R A G R A N D O P T I C S H E R M E S B O O K S V I V A C O M C C B
INVOKE G E O R O MOBILE
BACB EXPRESS
E C O F R E S H TAVEX PCT
SILVER LINE DIMS S U G A R L A N D
E X C E S S R E F A N
S W A R O W S K I A L A M A R MOMENTO ARTSTROY
I C E N T E R E S T I L
R O S E O F B U L G A R I A
OKAIDI P R E M I E R S H O E S THE BODY SHOP
R A D I A N T P R O F E S S I O N A L
AEYA NAILS
O P T I C L A S A IQOS
ANTIK-99
BEAUTY ZONE
F O O D & C U L T U R E B A R TORNADO
PANDORA
A 1
P U L S A R Z L A T N A R I B K A
E F B E T
XIMI VOGUE C O S T A C O F F E E
DIKA
KINDERLAND
J A R O C A F É
× 1 , 2
C O M S E D
LEONARDO HARIZNA
O N Y X W O M A N
MERCARI
TRIUMPH PATRIZIA PEPE F A N P O I N T C O N C E P T S T O R E
S C A N D A L
F A N P O I N T E X T R A V A G A N C E C O L L E C T I V E PAULA VENTI R E N I T E O D O R C O N C E P T F A B I A N O S H O E S L U C Y F A S H I O N ETIKET A N D R E W S
SPORT VISION
B U Z Z M A S O N ’ S G I A N N I
G I U L I A N D R E S S E S
PAOLO BOTTICELLI F U S I O N T W I N S E T T E O D O R
TIMEOUT
D A P H I N E
TIMELAND G I O V A N I MASSAGE CHAIRS RK ACCESSORIES
BMS INCANTO
C I N E M A C I T Y P L A Y G R O U N D
INCANTO STORAGE
CIELA
PIZZIO
M C D O N A L D S S T O R A G E
ATHLETIC
OLA
VISIT www.galleriaburgas.bg
SLIDE 21 21
BACK TO TOP
NOVA PARK
Nova Park is the dominant regional shopping centre in central Gorzow, western Poland, and has a diverse mix of high-quality tenants. The planned 3,100m2 GLA extension including a cinema and additional fashion, food and leisure offering is on hold due to Covid-19.
32,400m²
GLA
€5.9m
NRI
€82.3m
BOOK VALUE
85.0%
OCCUPANCY
100%
OWNED BY MAS
INCOME PROPERTY
SPHINX
BAZYLIA GROSZEK TUI
KOLPORTER
ZIAJA PLUS ZIELONE ZOO EKO PRALNIA T E L E T O R I U M
PLAY
ESMOKING WORLD
ITAKA
RAINBOW TOUR SWIAT GSM
M O H I T O
DANISH DESIGN TRIUMPH OPTIK
M A R L E N L A V A R D LANCERTO
GIACOMO CONTI
DUKA APART
RYLKO
CALZEDONIA
W . K R U K QUIOSQUE
M O N N A R I
V I S I O N E X P R E S S
L O O X
BERSHKA KIK
K U B E N Z E M P I K S U P E R P H A R M A P T E K A
FOTOJOKER VELURE ESOTIQ F R Y Z J E R E K
R O S S M A N N
OFFICE SHOES
HOME&YOU
W O J A S Y E S
I N T I M I S S I M I KSIEGARNIE
MOODO CASTELLARI
BRE BANK VOLVO
SWISS
P I O T R I P A W E L
LEVI’S
GATTA T I M E T R E N D
× 900
FABRYKA FORMY
BOBOQ K U C H N I A P O L S K A BERLIN DONNER NORTH FISH
50 STYLE
SZACHOWNICA BIG STAR
C I P O & B A X X
MEDIA EXPERT
HOMLA
ACAPULCO S O L V I S
HOUSE
FART
BAG HAUSE MADRE ELEGANCE
ECHO
B Y O H L A L A NEW YORK HOT DOG K A N D U L S K I R U C H
4F
BLUE SHADOW
SPORT FASHION MEDICINE BASHMIR A L O I W
TRADE MODE REPORTER YOUNG
5.10.15
PINO TOP TOYS SCOT FREE
COCCODRILLO
SMYK
DIVERSE S I Z E E R
PIT BULL
VISIT www.nova-park.pl
SLIDE 22 22
BACK TO TOP
ATRIUM MALL
Atrium Mall is Arad's largest shopping
- centre. With a population of approximately
160,000, the city is the county capital, hosts two universities and is an important industrial centre and transport hub. Easily reached by car, the shopping centre is located next to the main train and bus stations, five minutes walking distance from the city centre, and is easily accessible from any corner of the city, either by car,
- r by public transport. Refurbishment and
reconfiguration continues according to plan.
28,400m²
GLA
€4.4m
NRI
€54.9m
BOOK VALUE
85.5%
OCCUPANCY
100%
OWNED BY MAS
INCOME PROPERTY
VLADY’S ARMAN SPORT XARA SHOES
A L S E S S I A M A X X I M U S
G I N E T T E
D I N O L A N D ELLEN SHOES M E N ’ S S T Y L E GIFT SHOP
TRIUMPH
N O R I E L
GAD C&E MONDEX MEMORIES M I Z A R S N E A K E R S DIVERTA TUI NOMASVELLO N O B I L A C A S A LENTO A R I A N ’ S C O V E R S H O P SURPRISE FANY LUX TH TREND HOUSE C A R F U N L E N T O C A F E
MASSAGE CHAIRS ASSURANCE BROKER STORAGE STRADIVARIUS STORAGE PULL&BEAR STORAGE MESOPOTAMIA STORAGE MESOPOTAMIA S T O R A G E Q U A S I P R O N T I STORAGE CRISPY STORAGE BON PAPA STORAGE GIFT SHOP STORAGE MASTWEIGHT TEILOR
COCCODRILLO
OFFICE SHOES TUCANO COFFEE COZACONE M E L I M E L O P A N D O R A MOTIVI G I A B E I N T I M E SPLEND’OR DIGI
INMEDIO
LAVA E CUCE G A T T A GALL PRINT TEZYO TRESSOR
P R O F E S S I O N A L C O S M E T I C S
M E S O P O T A M I A
BAGUETTE OPTICRIS
BEST EXCHANGE
BERSHKA
P L U S O P T I C
MASSAGE CHAIRS N A L A F L O R A R I A
G L O
ISLAND OF LEATHER VOLKSWAGEN MILLERPERLINE AUTOMATIC TOYS FAN GSM C U P I O E G O W A Y I R I S
× 1,000 CINEMA CITY
GELATERIA VENETIA SUN AMOUR
F A I R Y L A N D GYM ONE
METROPOLIS
B O W L I N G MERCATO
S A L A D B O X KEN WOK ROLL N ROAST
DELIZIOSO
SPARTAN
BBQ & GRILL
BON PAPA CRISPY HOUSE QUASI PRONTI
LE RELAIS
S T O R A G E S T O R A G E S T O R A G E OFFICE
I Q O S
M A S S A G E C H A I R S COFFEE EXPERT GELATERIA VENETIA
VISIT www.atriummall.ro
SLIDE 23 23
BACK TO TOP
KAUFLAND CENTRES
This portfolio includes seven convenience centres with a high density of national and international anchors, including Deichmann, Jysk, and Pepco. They are easily accessible by car and public transport, and are close to densely populated residential areas. These developments were completed during 2017 and 2018.
Focsani Value Centre
27,800m²
GLA
€2.9m
NRI
€37.0m
BOOK VALUE
96.9%
OCCUPANCY
100%
OWNED BY MAS
SPORTISIMO
ANIMAX
NORIEL
× 175
INCOME PROPERTY
SLIDE 24 24
BACK TO TOP
BAIA MARE VALUE CENTRE
Baia Mare Value Centre has good accessibility, with a variety of public transport hubs in close proximity, and is located on the E58 European road, the main connection between Baia Mare and Transylvania region. The centre is part of the city's and region's main commercial areas, includes a Carrefour hypermarket and has a high concentration of anchor tenants, mainly fashion. The planned extension is on hold due to Covid-19.
21,300m²
GLA
€2.5m
NRI
€31.6m
BOOK VALUE
95.7%
OCCUPANCY
100%
OWNED BY MAS
Planned Extension DON CASH
ZOOMANIA
PETRU
BOUTIQUE 17
HOPPA DABO DONER
CHRISTIAN TOUR
RUSTIKA
ROBEST AVANGARD ROZA ORO
COMPAS
COVER SHOP
CETINA
TABAC XPRESS
EXCHANGE
ANIMAX CADOR NORIEL
SILCA MARIONNAUD
SMYK
SPORTISIMO
THE VIEW CAFE
MOBICELL COVER SHOP
SAVOY ROBEST
MISCHIATI FLORARIA LAURA
JACK GAMES
JUNGLA COPIILOR
BUY HOUDIN
× 1,270
INCOME PROPERTY
VISIT www.baiamarevaluecentre.ro
SLIDE 25 25
BACK TO TOP
ROMAN VALUE CENTRE
Roman Value Centre, located within walking distance from the city centre and next to the train station and regional bus station, is the city's largest retail
- destination. The centre integrates a Carrefour
hypermarket with a number of fashion and home decoration anchors. The planned extension is on hold due to Covid-19.
18,800m²
GLA
€2.5m
NRI
€33.1m
BOOK VALUE
98.4%
OCCUPANCY
100%
OWNED BY MAS
INCOME PROPERTY
Planned Extension Planned Extension Planned Extension DON CASH
SILCA PLAY AGAIN
COCO RINOO PALLINA GELATERIA DABO DONER PIZZA 21
CU SOS SPARTAN
ROBEST EXPRESS CREDIT
BOUTIQUE 17
AVANGARD EXCHANGE BUJITERIA ROYAL BONITO
MARCO BEBE SUPERSTAR
GM SHOES
CADOR
COVER SHOP
ANIMAX
KOSAROM CUFARUL VERDE
PETRU DOPOPOCO
NORIEL
CAFENEA ANTURAJ LE PREMIER KRISTALL OPTIC SUPERBET
BESTLINE
BARBER SHOP
BONCAFE
ANTURAJ
× 870
VISIT www.romanvaluecentre.ro
SLIDE 26 26
BACK TO TOP
BERSHKA
R U W A T C H
ANDREWS
H E R M E S B O O K S
PK Accesories
A R T 9 3
I N M E D I O E A S Y P A Y
JOY OPTICS
A Z A R I N I B A R G E L L O I K E Y S O O
S E L I N A J E W E L R Y
COMSED
× 590
GALLERIA STARA ZAGORA
Galleria Stara Zagora is the dominant retail destination in Stara Zagora, Bulgaria's sixth largest city with a population of over 140,000. Located at the crossroads of two major boulevards, it is easily accessible by public
- transport. Tenant mix favours fashion and
entertainment, including major international
- anchors. Refurbishment of the common areas
and food court was completed in August 2020.
24,100m²
GLA
€1.9m
NRI
€19.9m
BOOK VALUE
90.1%
OCCUPANCY
100%
OWNED BY MAS
INCOME PROPERTY
XIMI VOGUE
S U B R A
TELENOR
A 1 S E S S I L Y S P O R T V I S I O N
SILVER COURT LAZARINI E X E S S B O T E G R A N D O P T I C S V I V A C O M E V E L I N
FLAIR
P A U L A V E N T I M A Y O R A L E S T I L Z L A T N A R I B K A H E R O N
TEODOR
P A O L O B O T T I C E L L I
KIDS PLAY
RESTAURANT 5D CINEMA
PIZZIO
MR.DONER
BMS
C A T M I ’ S
CINEMA CITY
A T H L E T I C
CHARM
VISIT www.galleriasz.bg
SLIDE 27 27
BACK TO TOP
DN1 VALUE CENTRE
The DN1 Value Centre is located in Balotesti, Romania, in a rapidly developing and affluent residential area, approximately 25km north
- f Bucharest. The project has excellent road
access and benefits from a location on the DN1/E60, Romania's busiest national road. Completed in December 2019, the centre is integrated with an owner-occupied Hornbach and an owner-occupied Lidl supermarket. The planned extension is on hold due to Covid-19.
27,000m²
GLA
€3.7m
NRI
€49.0m
BOOK VALUE
94.4%
OCCUPANCY
40%
OWNED BY MAS
INCOME PROPERTY
CADOR
SPORTISIMO
NORIEL
GREGORY’S
BOUTIQUE 17
CAROL OPTIC GREIGE
TONI GELATO
TRIUMPH TOTAL WASH COVER SHOP
SILCA
ASKONA
GELATERIE BULEVARD
CADOR
JACK GAMES
LA BUFET
PALMIYE
KIDDUINO
TEZAUR BRO BISTRO
SPARTAN
JERRY’S PIZZA ABBRACCIO POLI
ATELIERUL DE BURGERI
CLIMB HOUSE
UNION BRANDS
HOMELUX
HOUSE
DIVERTA
PLANTE VESELE
LAS VEGAS CASINO MUMUSO
DIGI
MOBIUP BIJOUSIM LELAS PERFUMES PRESTIGE ASIGURARI DELICII PE ROTI DOMI COVER SHOP BIJUTERII HANDMADE ALINA
ANIMAX
SUPERBET
× 790
VISIT www.dn1valuecentre.ro
SLIDE 28 28
BACK TO TOP
ZALAU VALUE CENTRE
Located on the city's main boulevard and within 2.5km of the city centre, Zalau Value Centre's prominent position is accessible by car and public transport, close to the regional bus terminal, with excellent access to the E81 European road, and next to a densely populated residential area. The development was completed in November 2019.
19,300m²
GLA
€2.5m
NRI
€30.4m
BOOK VALUE
95.7%
OCCUPANCY
40%
OWNED BY MAS
INCOME PROPERTY
Drive-in Extension
NORIEL
CADOR ANIMAX
IN VOGUE
KULSASR CONF
SPARTAN
CURATATORIE SILCA JACK GAMES
BOSSINI
MAXXIMUS YUPPI KIDS
BOUTIQUE 17
KRYSTA MESOPOTAMIA
DIGI
MERON
LOC DE JOACA
NOBILACASA
SMITH & SMITH BULEVARD COVER SHOP
LAS VEGAS
COMPAS
ARMAN SPORT
JUICE BAR POSETTE COVER SHOP YUHUU KIDS CONTAKT RADA PERFUMES SMART VAPE MOBICELL COQUETTE MINIER
BELLA FASHION
× 650
VISIT www.zalauvaluecentre.ro
SLIDE 29 29
BACK TO TOP
JUBA CAFFE TEILOR SPLEND’OR
LITTLE BIG U.S. POLO ASSN.
TUI
KENDRA BOUTIQUE 17
SALAMANDER TRIUMPH OCASSIA
ZEKA CUPIO
I N T E R S P O R T
MGOLD
MUMUSO
SMYK H O U S E
SPORTISIMO
XPRESS COVER SHOP HAPPY DAY DOTS ANIMAX R A I M A R MELI MELO R A N K I N E R A N K I N E F A N G S M T O T A L W A S H
AVANGARD
K O S A B E A U T Y L A B S M O B I U P MINIER AND POSETTE COVER SHOP I N F I N I T Y L O V E MOBICELL CADOR BUNATATI ARDELENESTI SIMIGERIA MIHAI ERFOLG FASHION
N O R I E L
× 1 , 2 8
DAMBOVITA MALL
Positioned in a densely populated residential area, approximately 2km from Targoviste's centre and near the main train station, Dambovita Mall is the only regional retail destination in the county. Focusing on fashion and entertainment, it offers a modern shopping experience, including a multiplex, restaurants and playground. The mall
- pened on 20 August 2020, with 92% occupancy.
The completion and opening of the 1,700m2 GLA cinema is on hold due to Covid-19. The development can accommodate an additional extension of approximately 10,000m2 GLA, excluding cinema.
31,200m²
GLA
€4.4m
ERV
€45.7m
BUDGET
40%
OWNED BY MAS
DEVELOPMENT PROPERTY
Completed
MILLION
S P C R P C I V D A M B O V I T A
M I S S T W I S T XPRESS MESOPOTAMIA SPARTAN
VISIT www.dambovitamall.ro
SLIDE 30 30
BACK TO TOP
SEPSI VALUE CENTRE
Sfantu Gheorghe, with a population of approximately 54,000, is the capital of Covasna
- County. The project is located in a densely
populated residential area, approximately 2km from the city centre. Located on E578 European road, it has a prominent position. Construction is currently on hold, however, based on the strong performance of anchor tenants in
- pen-air malls, work resumes in September
- 2020. The opening of the open-air mall's first
phase, with emphasis on anchor tenants, is scheduled for the second quarter of 2021.
16,300m²
GLA
€1.8m
ERV
€19.3m
BUDGET
40%
OWNED BY MAS
NORIEL
FASHION FASHION FASHION
SPORTISSIMO
ECD CAFE
COMPAS
COVER SHOP AVANGARD TABAC XPRESS
BOUTIQUE 17
NO WASTE COFFEE SPARTAN
PRIMA ICECREAM
NOBILCASA
PLAY AGAIN
× 720
DEVELOPMENT PROPERTY
WIP
SLIDE 31 31
BACK TO TOP
ARGES MALL
Centrally located in one of Pitesti's dense residential areas, next to the main train station and the main boulevard, not to mention easily accessible from the A1 Motorway, Arges Mall will make a substantial contribution to the local economy and has the full support
- f local authorities. Tenant interest in the
planned retail consolidation remains strong.
56,100m²
GLA
€8.4m
ERV
€92.9m
BUDGET
40%
OWNED BY MAS
DEVELOPMENT PROPERTY
Permitting
F I T N E S S C I N E M A
HYPERMARKET
FASHION ANCHOR
FASHION ANCHOR F A S H I O N A N C H O R F A S H I O N A N C H O R F A S H I O N A N C H O R F A S H I O N A N C H O R F A S H I O N A N C H O R F A S H I O N A N C H O R F U R N I T U R E A N C H O R E L E C T R O N I C S A N C H O R
ELECTRONICS ANCHOR
× 2 ,
SLIDE 32 32
BACK TO TOP
PRAHOVA VALUE CENTRE
This planned open-air mall is located in Ploiesti, the capital
- f Prahova County, near the main train, tram and bus
- stations. The development includes a high concentration
- f anchor tenants integrated into the existing, adjacent
Kaufland hypermarket and Lidl supermarket.
20,800m²
GLA
€2.5m
ERV
€28.1m
BUDGET
40%
OWNED BY MAS
DEVELOPMENT PROPERTY
Permitting
FASHION FASHION FASHION FASHION FASHION FASHION FASHION SPORTS TOYS ELECTRONICS ELECTRONICS FURNITURE
HYPERMARKET
× 720
SLIDE 33 33
BACK TO TOP
BARLAD VALUE CENTRE
Barlad is a municipality in Vaslui County with approximately 70,000 residents. Located in southern Barlad, this development enjoys a prominent position on the E581 with quick and easy access from the city centre, as well as nearby communities.
16,700m²
GLA
€1.7m
ERV
€18.0m
BUDGET
40%
OWNED BY MAS
DEVELOPMENT PROPERTY
Permitting
SPARTAN
SPORTISSIMO
NORIEL
JACK CASINO
FASHION FASHION
FASHION
AVANGARD
INMEDIO PLAY AGAIN
FASHION
× 880
SLIDE 34 34
BACK TO TOP
ALBA IULIA VALUE CENTRE
Alba Iulia is an important historical and tourist destination, located in central Romania. The planned open-air mall is situated next to a densely populated area with excellent visibility and access to E81 European road and includes a high concentration
- f fashion anchors and the city's first hypermarket.
19,300m²
GLA
€2.2m
ERV
€23.4m
BUDGET
40%
OWNED BY MAS
DEVELOPMENT PROPERTY
Zoning
HYPERMARKET
FASHION TOYS FASHION FOOTWEAR SPORTSWEAR
SPORTSWEAR
ELECTRONICS
ELECTRONICS
FASHION
FASHION FASHION FURNITURE
FASHION DRUGSTORE
× 700
SLIDE 35 35
BACK TO TOP
FASHION ANCHOR FASHION ANCHOR
FASHION ANCHOR
ROVERE
FASHION ANCHOR FASHION ANCHOR FASHION ANCHOR FASHION ANCHOR
FASHION ANCHOR
FASHION ANCHOR E L E C T R O N I C S A N C H O R
FASHION ANCHOR
× 3,150
F I T N E S S CINEMA
MALL MOLDOVA EXTENSION
The extension of Mall Moldova will create a super-regional mall serving eastern Romania and neighbouring Republic
- f Moldova. The centre will include the
region's largest hypermarket, over 200 stores, more than 30 restaurants, large entertainment area, a cinema, DIY store and furniture shops. Construction was suspended in March 2020 due to Covid-19.
58,600m²
GLA
€9.8m
ERV
€108.4m
BUDGET
40%
OWNED BY MAS
DEVELOPMENT PROPERTY
On hold
SLIDE 36 36
BACK TO TOP
Marmura Residence comprises five, high-quality, high-rise apartment buildings above an integrated underground parking, and has several unique features: an urban park linking it to the neighbourhood, vibrant cafes and community spaces, a central plaza, rooftop terraces, convenient services, and direct connections to the city. Sales figures continue to be encouraging and construction continues on schedule.
MARMURA RESIDENCE
36,100m²
GSA
459
UNITS
€41.7m
BUDGET
40%
OWNED BY MAS
DEVELOPMENT PROPERTY
WIP
VISIT www.marmuraresidence.ro
SLIDE 37 37
BACK TO TOP
Avalon Estate is an unique gated community, located between Pipera and Aviatiei neighbourhoods, in northern Bucharest. The project is being developed on an 8.1ha plot close to the city's business district, providing a centralised location for its residents. Designed with great attention to detail and arranged around a large park, this development has low traffic flow and exclusive community services. Avalon Estate borders a natural lake and offers many valuable benefits, such as privacy, security and a private village-type setting. Construction commences in September 2020.
AVALON ESTATE
96,700m²
GSA
746
UNITS
€106.7m
BUDGET
40%
OWNED BY MAS
DEVELOPMENT PROPERTY
Permitting
VISIT www.avalonestate.ro
SLIDE 38 38
BACK TO TOP
A large 10ha mixed-use, urban renewal development project, that combines several functions increasing the efficiency of infrastructure, amenities and services. Primary functions include an A-grade office component with BREEAM Excellent certification and high-quality apartments. Residential components employ a clean design and whole building approach within a pedestrian-friendly setting, integrated into a larger ‘work, play and live’ environment. Unit pricing is aimed at the middle income market segment while quality is on a par with higher-end developments. Given the potential negative impact of Covid-19 on office demand, planning continues with primary emphasis on the residential elements.
SILK DISTRICT
118,100m²
GSA
1,600
UNITS
€113.6m
BUDGET
40%
OWNED BY MAS
113,700m²
GLA
€163.6m
BUDGET
40%
OWNED BY MAS
DEVELOPMENT PROPERTY
Permitting
Residential Office
VISIT www.silkdistrict.ro
SLIDE 39 39
BACK TO TOP
BOARD OF DIRECTORS
Martin Slabbert, CEO
BCom, LLB (cum laude), MCom (cum laude), Dip FMI, CF (England and Wales)
Martin has over 25-years of real estate, turn-around and fjnance industry experience, including 15 years in CEE. He founded Prime Kapital in 2015, and prior to this he was CEO of New Europe Property Investments, which he established with Victor Semionov in 2007. He was a Partner at Deloitte Central Europe (Corporate Finance) after an investment banking and corporate turn-around career in South Africa, which included various senior management roles before 2005. He was appointed as MAS’ CEO in November 2019.
Victor Semionov, CFO
BCom
Victor has over 20-years of real estate, turn-around and fjnance industry experience. He founded Prime Kapital in 2015, and prior to this he was CFO and COO
- f New Europe Property Investments, which he established with Martin Slabbert in 2007. He was previously an Assistant Director at Deloitte Central Europe
(Corporate Finance). Victor was appointed as MAS’ CFO in November 2019.
SLIDE 40 40
BACK TO TOP
Claudia Pendred, Independent Non-Executive Director
BA (University of Oxford), MA (Harvard), MBA (INSEAD)
Claudia was director with the European Bank for Reconstruction and Development (EBRD), where she managed the Bucharest offjce and later EBRD’s Property and Tourism team in London. Prior to that she worked for the World Bank, NM Rothschild & Sons and J Henry Schroder Wagg. Claudia has over 25-years of experience in the CEE markets.
Dan Pascariu, Independent Non-Executive Director
MBA
Dan is a Non-Executive Director for Transfond, Azomures, Techtex and ANA Teleferic. Prior to this, he held a broad range of senior executive and non-executive positions, including Chairman of Unicredit Bank of Romania until 2020 and Chairman of NEPI Rockcastle for 9 years until his departure in 2018. He has over 40 years of experience in the CEE banking sector, having co-founded the Romanian Banking Institute and being instrumental in the 1990’s banking reform.
Werner Alberts, Independent Non-Executive Interim Chairman
BCom Hons (Acc), CA (SA), ACA (ICAEW)
Werner was appointed as Interim Chairman of MAS’ Board of Directors in November 2019. He is currently the COO of Capital International Group, and is a qualifjed chartered accountant with over 25 years’ experience in the fjnance industry.
Brett Nagle, Independent Non-Executive Director
BCom Hons (Acc), CA (SA)
Brett is a director of Safe Mode Investment Proprietary trading as Panacea Capital, which focuses on investment management, and an Independent Non- Executive Director of Attacq. Prior to this he was Head of Investments for Royal Bafokeng Holdings Proprietary, served as a Non-Executive Director of Impala Platinum Holdings and worked for Rand Merchant Bank, a division of FirstRand Bank.
BOARD OF DIRECTORS
SLIDE 41 41
BACK TO TOP
Vasile Iuga, Independent Non-Executive Director
ACCA (Fellow)
Vasile retired from PwC Romania, following 26 years with the fjrm. He acted as the Managing Partner for South East Europe and has extensive experience in international accounting standards, fjnancial audit, corporate governance and consultancy. He oversaw the implementation of IFRS in Romania, and is currently a member of the Audit Committee of the European Investment Bank and Non-Executive director of two listed entities, Alro SA and Patria Bank, chairing their audit
- committees. He is a member of a number of professional bodies including ACCA.
Malcolm Levy, Non-Executive Director
MCom, MBA (Oxon), CA (SA), CFA
Malcolm co-founded MAS and served as CFO for over 9 years following the Group’s inception, becoming a Non-Executive Director in June 2019. Prior to joining, he was an equities fund manager and investment analyst in London.
Melt Hamman, Non-Executive Director
BCom Hons (Acc), CA (SA)
Melt is CEO of Attacq and has extensive experience in real estate, banking and business.
Pierre Goosen, Independent Non-Executive Director
BCom (Law), LLB, MBA
Pierre is Managing Director of Argosy Capital, a European-based private equity and venture capital investment business. Prior to Argosy, he worked at two international law fjrms as a commercial, private equity and funds lawyer.
BOARD OF DIRECTORS
SLIDE 42 42
BACK TO TOP
DEVELOPMENT JOINT VENTURE STRUCTURE
MAS invested equity, provides preference share capital, and provides asset and property management services to the DJV. €420m in 7.5% coupon non-voting cumulative redeemable preference shares commitment, of which €178.7m drawn as at 30 June 2020 Prime Kapital invested equity, contributed its secured development pipeline at cost, takes responsability for sourcing further developments and provides the DJV with all required construction and development services via its integrated in-house platform on an exclusive basis.
40% Ordinary Shares
€20m
60% Ordinary Shares
€30m
7.5% 8.0% 8.5% 9.0% 9.5% 10.0% 10.5% 11.0% 11.5% 12.0% 12.5% 13.0% 13.5% 11% 19% 26% 33% 41% 48% 56% 63% 70% 78% 85% 93% 100% 100% 90% 80% 70% 60% 50% 40% 30% 20% 10% 50% 45% 40% 35% 30% 25% 20% 15% 10% 5%
Project yield on cost Development margin* * Development margin is calculated assuming an average exit yield of 6.75% for commercial projects and an average project time to completion of 1.25 years. MAS' share in development margin (LHS) MAS' development profit margin (incl. preference share dividend) (RHS)
DJV
SLIDE 43 43
BACK TO TOP
BENEFICIAL SHAREHOLDERS HOLDING OVER 5% Jun 20
Shares % Attacq Ltd 146,818,251 20.73 Prime Kapital Holdings Ltd and associates* 96,673,222 13.65 Government Employees Pension Fund 53,212,358 7.51 Argosy Capital Ltd 50,611,622 7.15 347,315,453 49.04
* Associates represent shareholdings of DJV, Martin Slabbert, Victor Semionov, and other Prime Kapital Partners and their associates.
SLIDE 44 44
BACK TO TOP
GLOSSARY
Proportionate accounts reportable segments Segment results include items directly attributable to a segment as well as those that can be allocated on a reasonable basis. CEE direct portfolio (CEE, IJV) Income properties located in CEE fully owned and managed by the Group. Until 27 November 2019, these properties were housed in the IJV and consequently the Company recognised 80% of the fjnancial result in respect thereof. Following the Transaction, the Group accounts for 100% of these properties. CEE development joint venture (DJV) Income and development properties located in the CEE, indirectly owned through the DJV with Prime Kapital. Information presented represents the Group’s 40% share in the joint venture. In addition, the segment includes
- ther balances and transactions in relation to the DJV, including 60% of the preference share exposure (40% of the
redemption value and income related to preference shares is eliminated on proportionate consolidation). WE direct portfolio (WE) Income properties located in WE (Germany, UK, Switzerland) fully owned by the Group. Corporate (Co) Other assets, liabilities and activities related to the Group’s management, including investments in listed securities, Group level fjnancing, as well as corporate level administration. Adjustments to proportionate accounts
1 Net dividends – listed securities
Dividends from listed securities are recognised in adjusted distributable earnings on a basis which is commensurate and is matching the holding period of the securities with the reporting period of the Company. Consequently, any excess or shortfall in dividends received is reclassifjed ‘to’ and, respectively, ‘from’ non-distributable earnings (fair value movements in listed securities).
2 Goodwill
No goodwill is included in adjusted proportionate accounts. Consequently, goodwill and related impairments are eliminated.
3 Share-based payments
The allocation of part of the purchase price to share-based payments is an accounting treatment required under IFRS. Share-based payments related to the Transaction are reversed in adjusted proportionate accounts so that the entire Transaction purchase price is treated as being paid for Prime Kapital’s efgective economic interest in the IJV and all amounts exceeding the net tangible asset value thereof eliminated.
4 Deferred tax
Deferred tax, which is unlikely to crystallise on disposal as an actual tax, a purchase price adjustment or any other cost.
5 Contingent costs
Estimated costs likely to crystallise on disposal of the assets in WE, including punitive fjxed-interest arrangements, early bank debt repayment penalties, agency fees and other related costs.
6
Elimination of crossholding between MAS and associate Elimination of the proportionate part of the fjnancial asset recognised by the associate representing MAS shares, at cost. Weighted number of shares for the period and Closing number of shares for proportionate accounting purposes are computed by elimination of MAS' 40% share of own shares acquired by the associate.
SLIDE 45 45
BACK TO TOP
GLOSSARY
Acq/Dev, A/D Acquired / Developed BREEAM Excellent Independent third-party certifjcation of the assessment on the sustainability of individual buildings, communities and infrastructure projects, that recognises and refmects the sustainability of assets BV Book value based on independent market valuations in respect of Income property Capex Capital expenditure, funds used by the Group for improvements to and/or maintenance of Income property CEE Central and Eastern Europe Company MAS Real Estate Inc. Covid-19 Pandemic resulted following the global spread of the infectious disease caused by severe acute respiratory syndrome coronavirus 2 (SARS-CoV-2) DCF Discounted cash fmows (method of property valuation) Development property Property under construction, in process of being developed for future use as income property or for sale and land plots to be utilised for future developments Distributable earnings Distributable earnings represents the underlying earnings of the Group from net rental income from income property, net income from preference shares, net dividends on listed securities, net corporate expenses, interest on debt fjnancing, interest capitalised on developments,
- ther distributable net income or cost and income tax
DIY Do-it-yourself, hardware stores selling household hardware for home improvement DJV Development joint venture ERV Estimated rental value GLA Gross leasable area, the amount of retail fmoor space available to be rented in commercial properties, excluding short-term leases, terraces, storage areas and parking Group MAS Real Estate Inc. and its subsidiaries GSA Total gross sellable area, including residential and commercial and/or offjce areas ha Hectare, or 10,000 square meters IFRS International Financial Reporting Standards IJV Investment joint venture, former joint venture with Prime Kapital, 80% owned and controlled by the Company, for investing in CEE Income properties Income property Property held to earn rental income INT Interest expense Investment property Income property, Development property and Land bank IT Information Technology JSE Johannesburg Stock Exchange Land bank Land plots held for future developments LFL Like-for-like, measure of growth adjusted to exclude new or disposed properties LTV Loan to value, the ratio of the nominal value of debt less cash to investment property, listed security and preference shares m million m2 square meter NAV Net asset value Tangible NAV Net asset value which includes only assets and liabilities likely to crystallise on disposal, and corresponds to net asset value under adjusted proportionate accounts NCI Non-controlling interest ND Net debt, interest-bearing borrowings less cash and cash equivalents NRI Net rental income OCR Occupancy cost ratio, the total of all expenses the tenants pay for their retail space, as a ratio to their turnovers REIT portfolio Investment in listed real estate securities Transaction The acquisition on 27 November 2019 by the Group of Prime Kapital’s efgective economic interest in the IJV with MAS UK United Kingdom VAT Value added tax vs. Compared to WACD Weighted average cost of debt WE Western Europe or Western European WIP Work in progress, currently under construction
SLIDE 46