
SLIDE 1
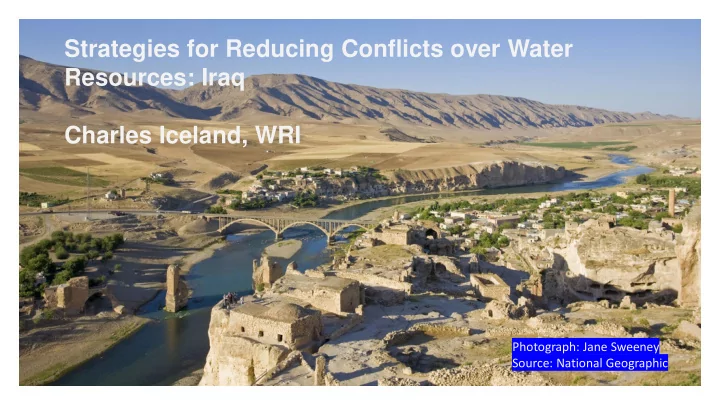
Strategies for Reducing Conflicts over Water Resources: Iraq Charles Iceland, WRI
Photograph: Jane Sweeney Source: National Geographic
Resources: Iraq Charles Iceland, WRI Photograph: Jane Sweeney - - PowerPoint PPT Presentation
Strategies for Reducing Conflicts over Water Resources: Iraq Charles Iceland, WRI Photograph: Jane Sweeney Source: National Geographic Basra, Iraq, September 2018: Iraqi protesters break into an official building as they demonstrate against
Photograph: Jane Sweeney Source: National Geographic
Basra, Iraq, September 2018: Iraqi protesters break into an official building as they demonstrate against the government and the lack of basic services in Basra on September 6, 2018.Haidar Mohammed Ali/AFP/Getty Images. –Vox September 8, 2018.
Photo: LooxLex
Photo caption: Sewage is dumped into one of the rivers extending to Shatt al-Arab in Basra, Iraq. Photo: Reuters. Source: 2019 www.behindthelogos.org
SOLUTIONS RISK DRIVERS
New centralized sources of water (wastewater treatment and reuse for industry, irrigation) Diminished rainfall More severe droughts Increasing temperatures Transboundary water-sharing agreements Lack of effective transboundary water-sharing agreements Water use limitation/demand caps Population policies that lower fertility rates Increasing water demand Increasing population Demand too high relative to supply New centralized sources of water (wastewater treatment and reuse for industry, irrigation) Lack of wastewater treatment Water efficiency and conservation improvements Food security policies; open global food market access Urban/rural development policies Inefficient water use in agriculture Leak-detection technologies and reduced water losses Massive losses in urban water systems Reduced corruption Improved governance Data collection and information systems Corruption Poor governance Lack of accountability Gender equality Gender inequality
Winter precipitation trends in the Mediterranean region for the period 1902 - 2010. Credit: NOAA (from Hoerling et al., 2011).
Reds and oranges highlight lands around the Mediterranean that experienced significantly drier winters during 1971-2010 than the comparison period of 1902-2010. Credit: NOAA (from Hoerling et al., 2011).
Source: NASA
Source: Wiltgen, N. 2015. “Feels-Like Temp Reaches 164 Degrees in Iran, 159 in Iraq; Days Off Ordered as Mideast Broils in Extreme Heat Wave.” Weather.com. August 5, 2015.
Gleick 2014. Annual average discharge of the Euphrates River measured at Jarabulus just downstream of the Turkey–Syria border from 1937 to 2010 (data from UN-ESCWA 2013).
The surface area of the Mosul Dam reservoir has shrunken by 63% over the past two decades (Iceland, Luo, and Donchyts 2018).
Source: Al-Ansari, N., S. Aljawad, N. Adamo, V. Sissakian,
the Tigris and Euphrates Catchments.”
Source: ARDI-Irrigation water assessment and priorities for Iraq, 2004. Cited in FAO. 2012. “Iraq – Agriculture sector note.” FAO Investment Centre.
Source: Alwash, A., H. Istepanian, R. Tollast, and Z.Y. Al-
Management in Iraq.” Iraq Energy Institute. Publication Number: IEI 300818. 30 August 2018.
Sources: Vilardo and Bittar 2018, Morna 2000, Mommen, Humphries-Waa and Gwavuya 2017, Kholif and Elfarouk 2014, UNDP and Gender and Water Alliance 2006, Lecoutere, D'Exelle and Van Campenhout 2015, UNFPA 2018.
SOLUTIONS RISK DRIVERS
New centralized sources of water (wastewater treatment and reuse for industry, irrigation) Diminished rainfall More severe droughts Increasing temperatures Transboundary water-sharing agreements Lack of effective transboundary water-sharing agreements Water use limitation/demand caps Population policies that lower fertility rates Increasing water demand Increasing population Demand too high relative to supply New centralized sources of water (wastewater treatment and reuse for industry, irrigation) Lack of wastewater treatment Water efficiency and conservation improvements Food security policies; open global food market access Urban/rural development policies Inefficient water use in agriculture Leak-detection technologies and reduced water losses Massive losses in urban water systems Reduced corruption Improved governance Data collection and information systems Corruption Poor governance Lack of accountability Gender equality Gender inequality
PHOTO: BOB NICHOLS | USDA